> ## Documentation Index
> Fetch the complete documentation index at: https://langchain-5e9cc07a-preview-update-1770920925-e15dbde.mintlify.site/llms.txt
> Use this file to discover all available pages before exploring further.

# How to compare experiment results

When you are iterating on your LLM application (such as changing the model or the prompt), you may want to compare the results of different [*experiments*](/langsmith/evaluation-concepts#experiment).

LangSmith supports a comparison view that lets you hone in on key differences, regressions, and improvements between different experiments.

## Open the comparison view

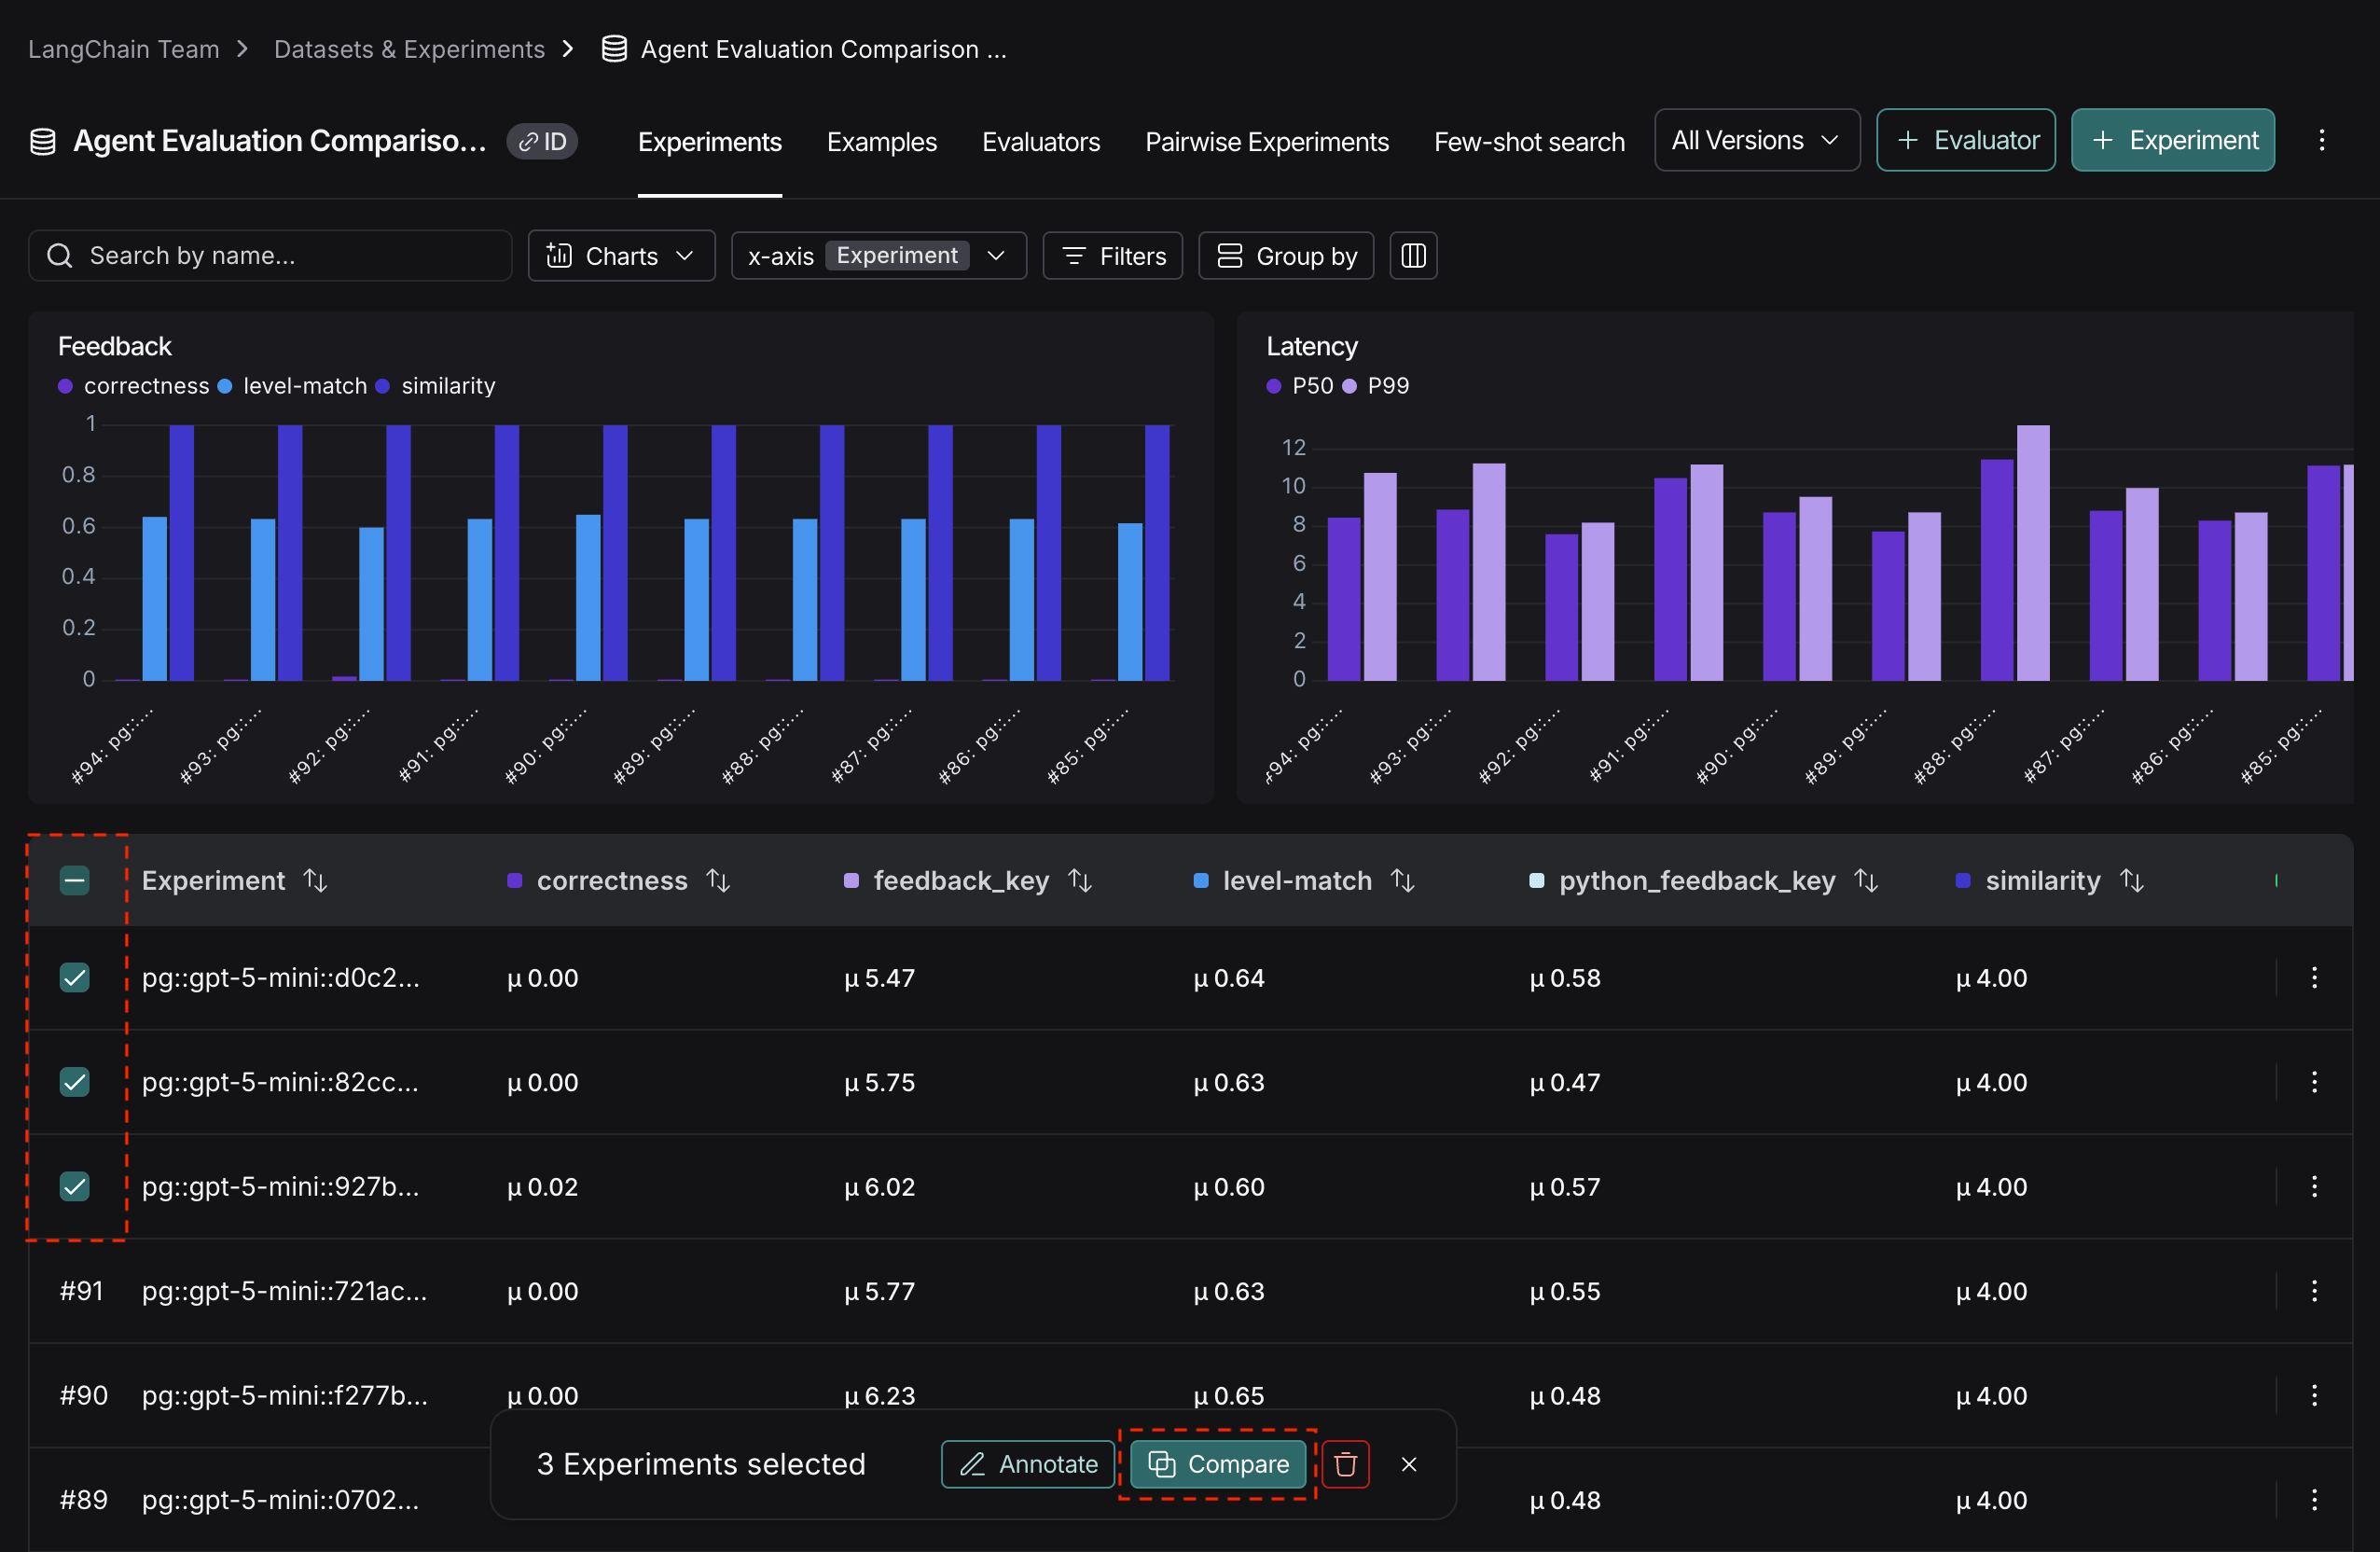
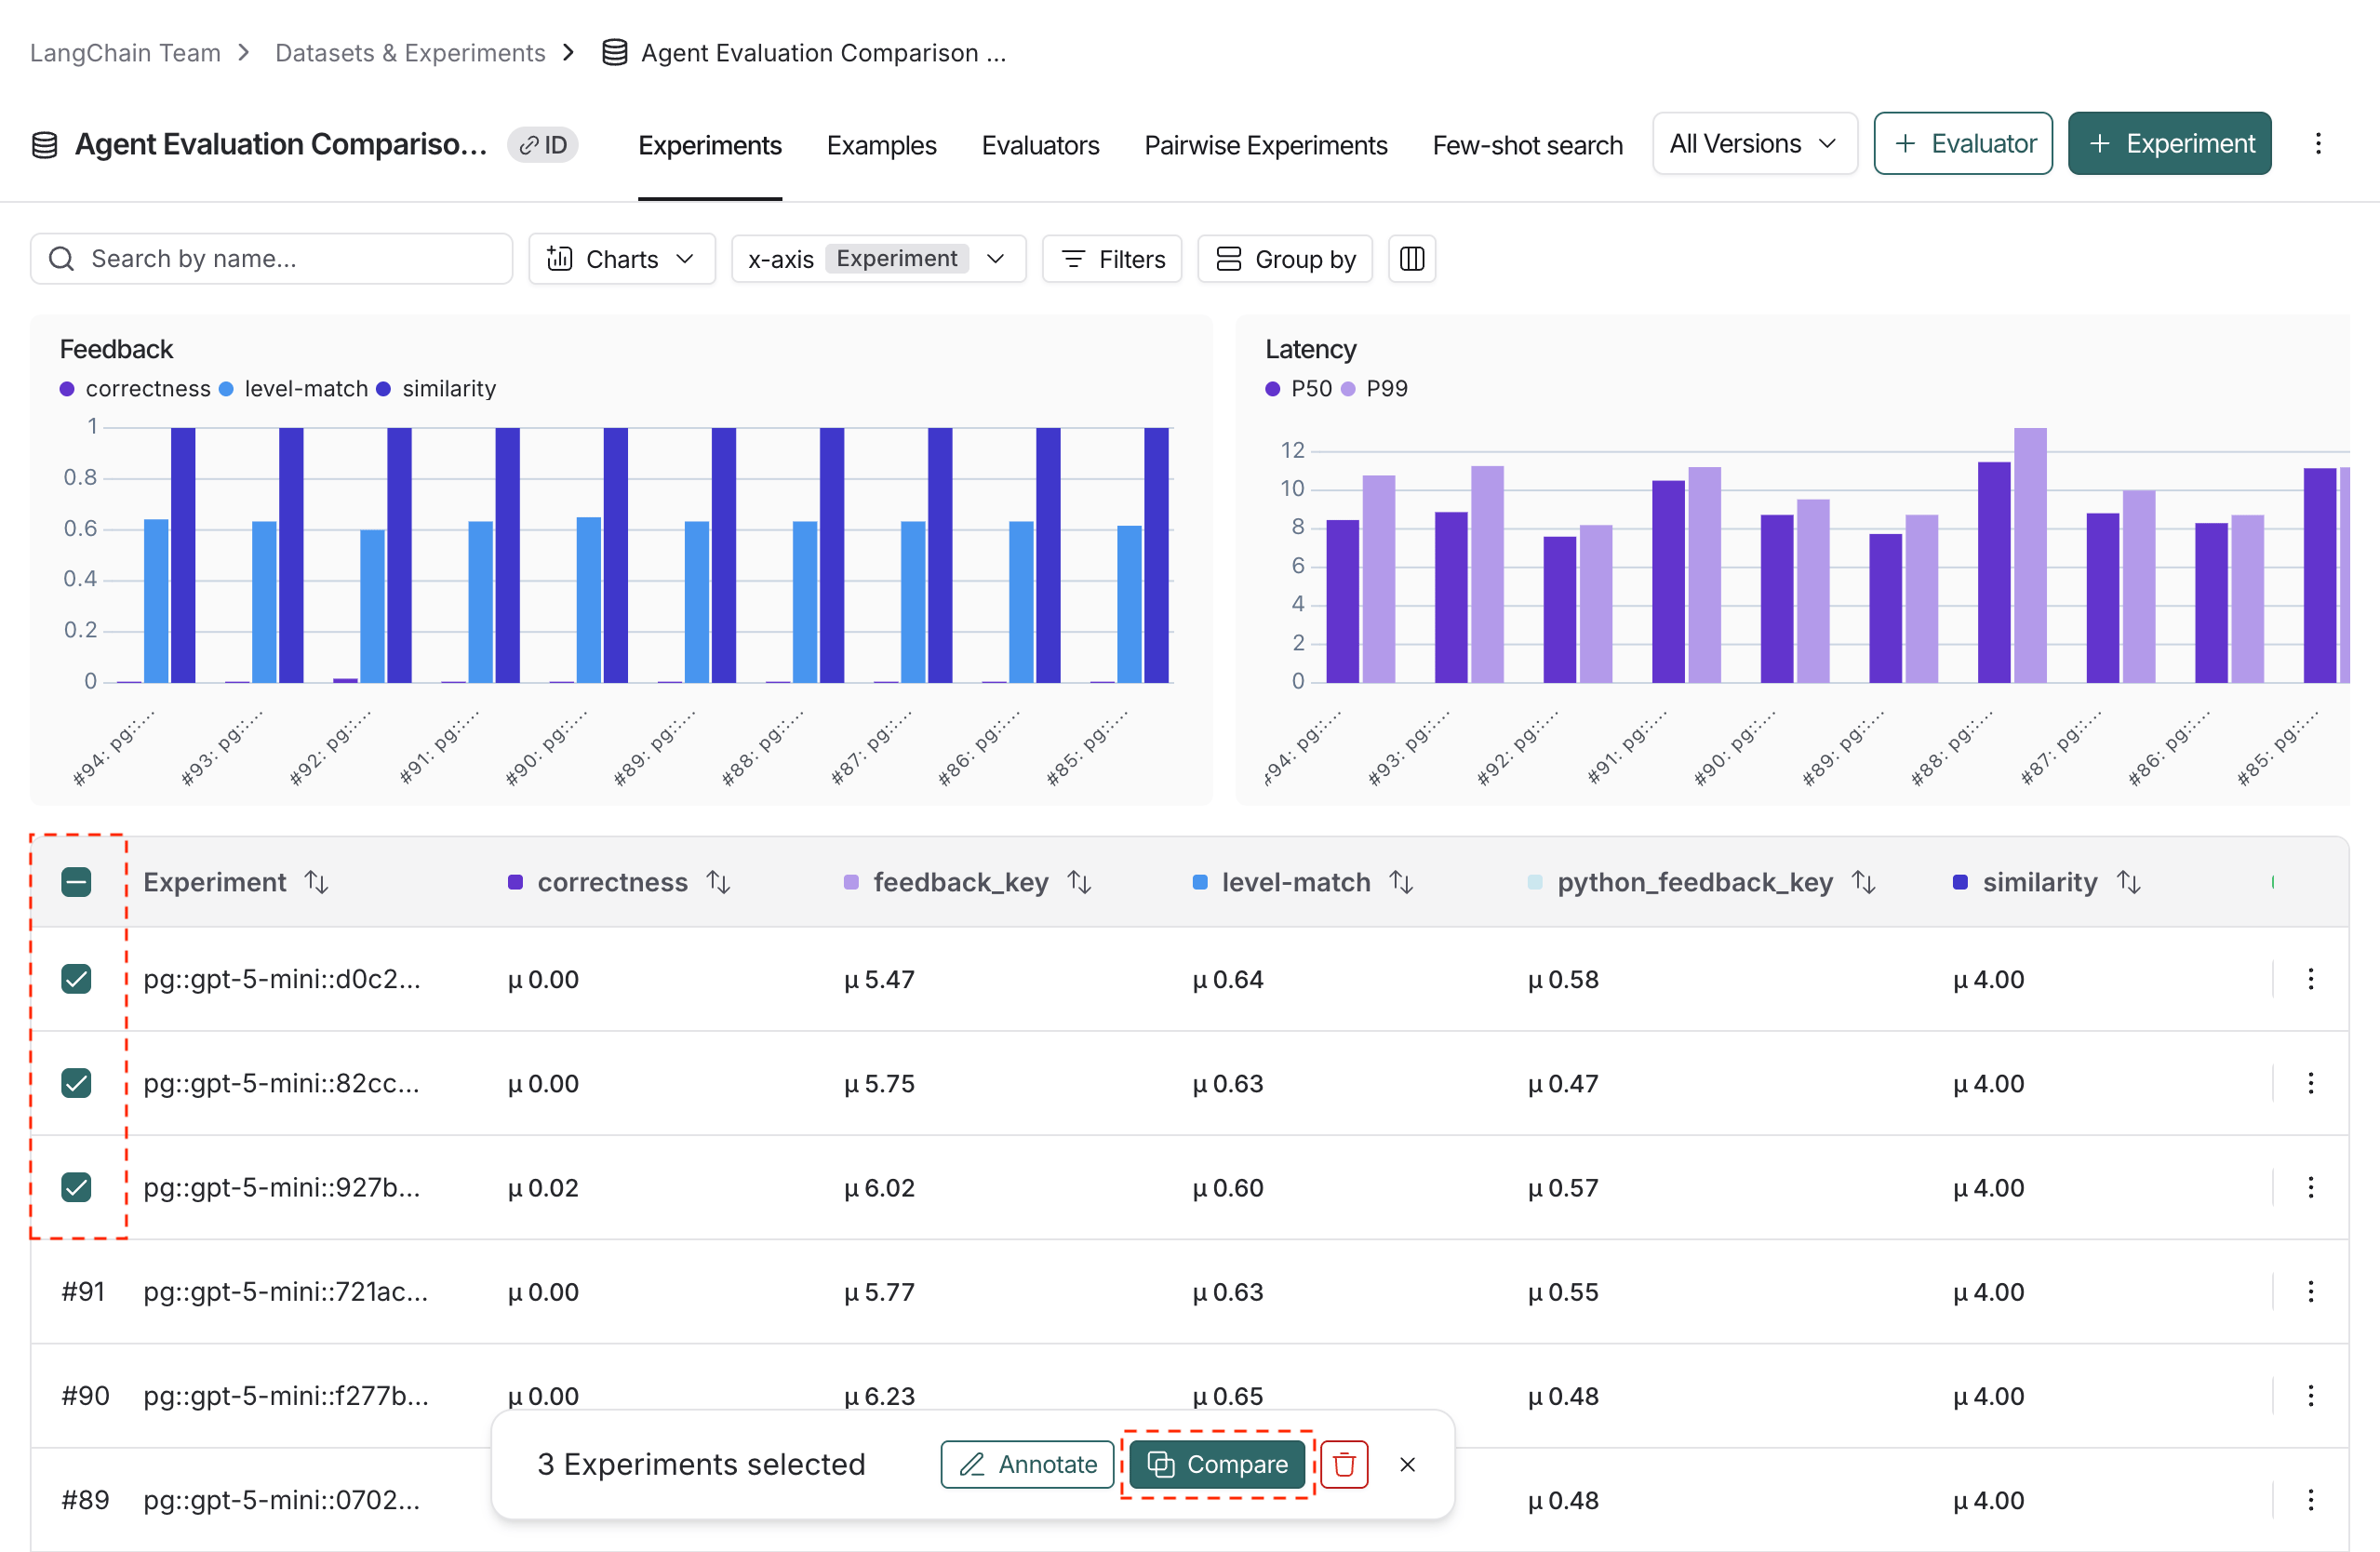
1. To access the experiment comparison view, navigate to the **Datasets & Experiments** page.
2. Select a dataset, which will open the **Experiments** tab.
3. Select two or more experiments and then click **Compare**.

<div style={{ textAlign: 'center' }}>
  <img className="block dark:hidden" src="https://mintcdn.com/langchain-5e9cc07a-preview-update-1770920925-e15dbde/5uc5P7xRzXySGIiJ/langsmith/images/compare-select-light.png?fit=max&auto=format&n=5uc5P7xRzXySGIiJ&q=85&s=14409a3c2552535ab84df2e8ea7676c5" alt="The Experiments view in the UI with 3 experiments selected and the Compare button highlighted, in light mode." width="2558" height="1668" data-path="langsmith/images/compare-select-light.png" />

  <img className="hidden dark:block" src="https://mintcdn.com/langchain-5e9cc07a-preview-update-1770920925-e15dbde/5uc5P7xRzXySGIiJ/langsmith/images/compare-select-dark.png?fit=max&auto=format&n=5uc5P7xRzXySGIiJ&q=85&s=95ffe3813845457d5a43151a1c374b08" alt="The Experiments view in the UI with 3 experiments selected and the Compare button highlighted, in dark mode." width="2552" height="1664" data-path="langsmith/images/compare-select-dark.png" />
</div>

## Adjust the table display

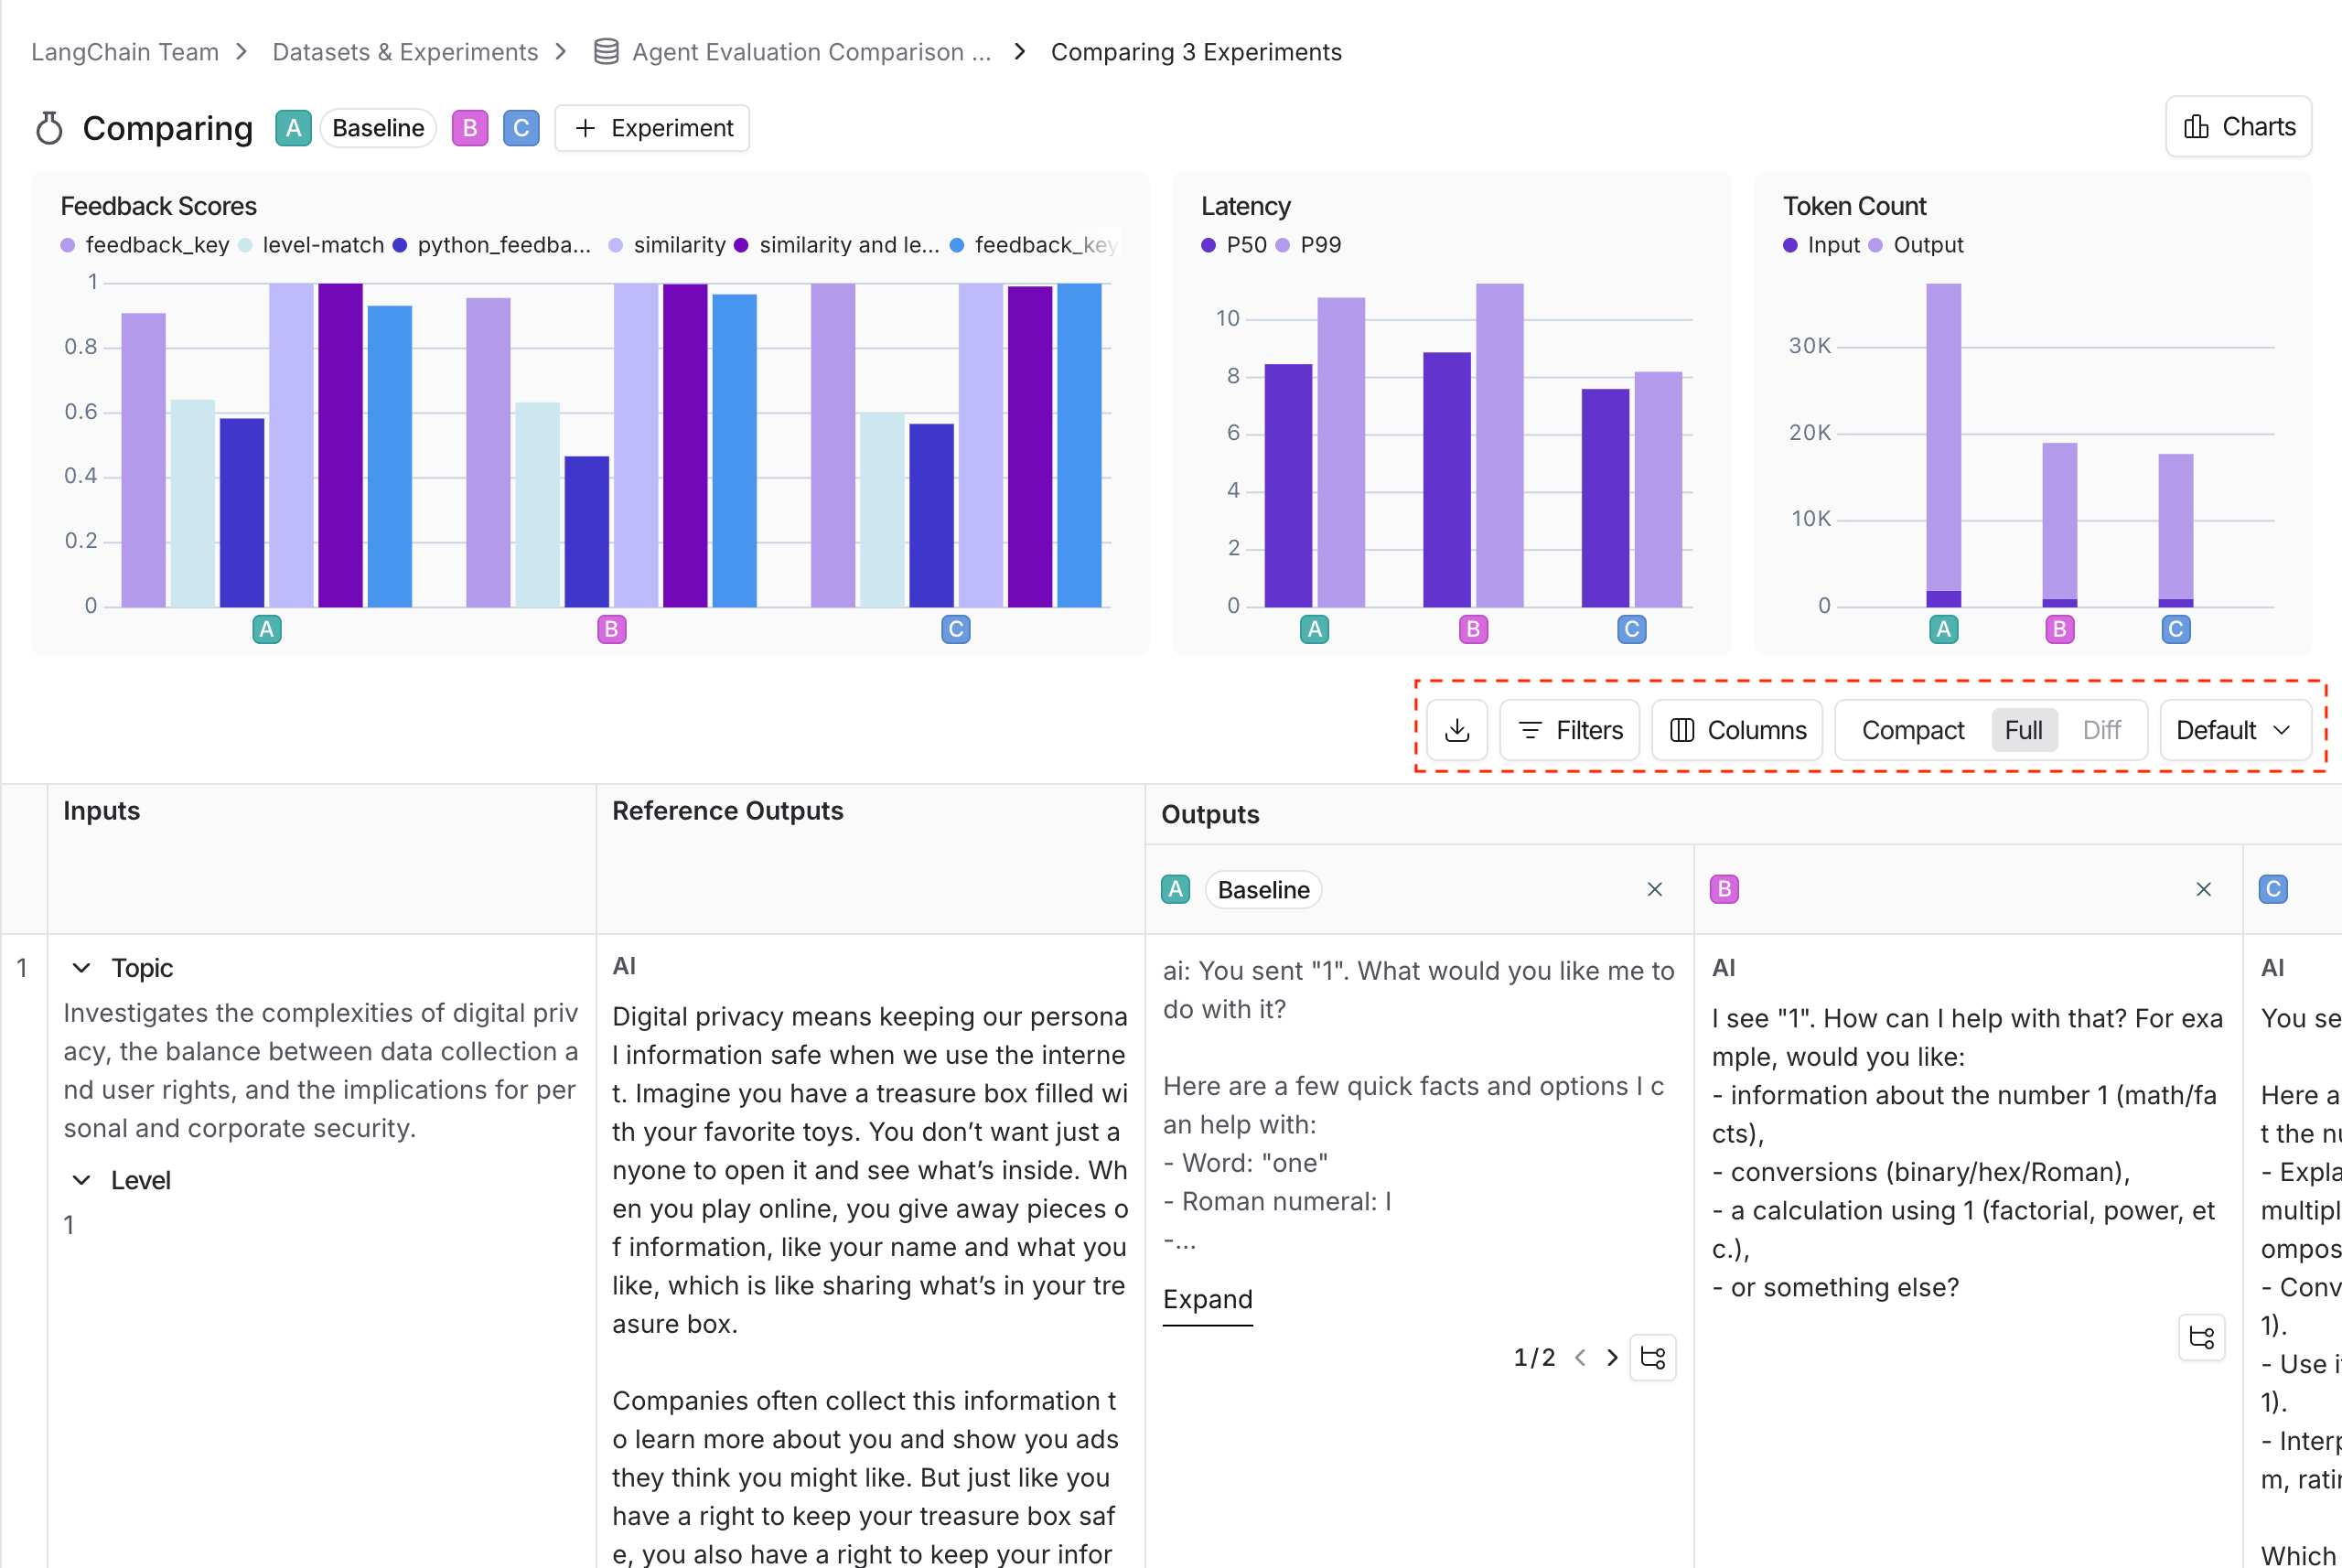
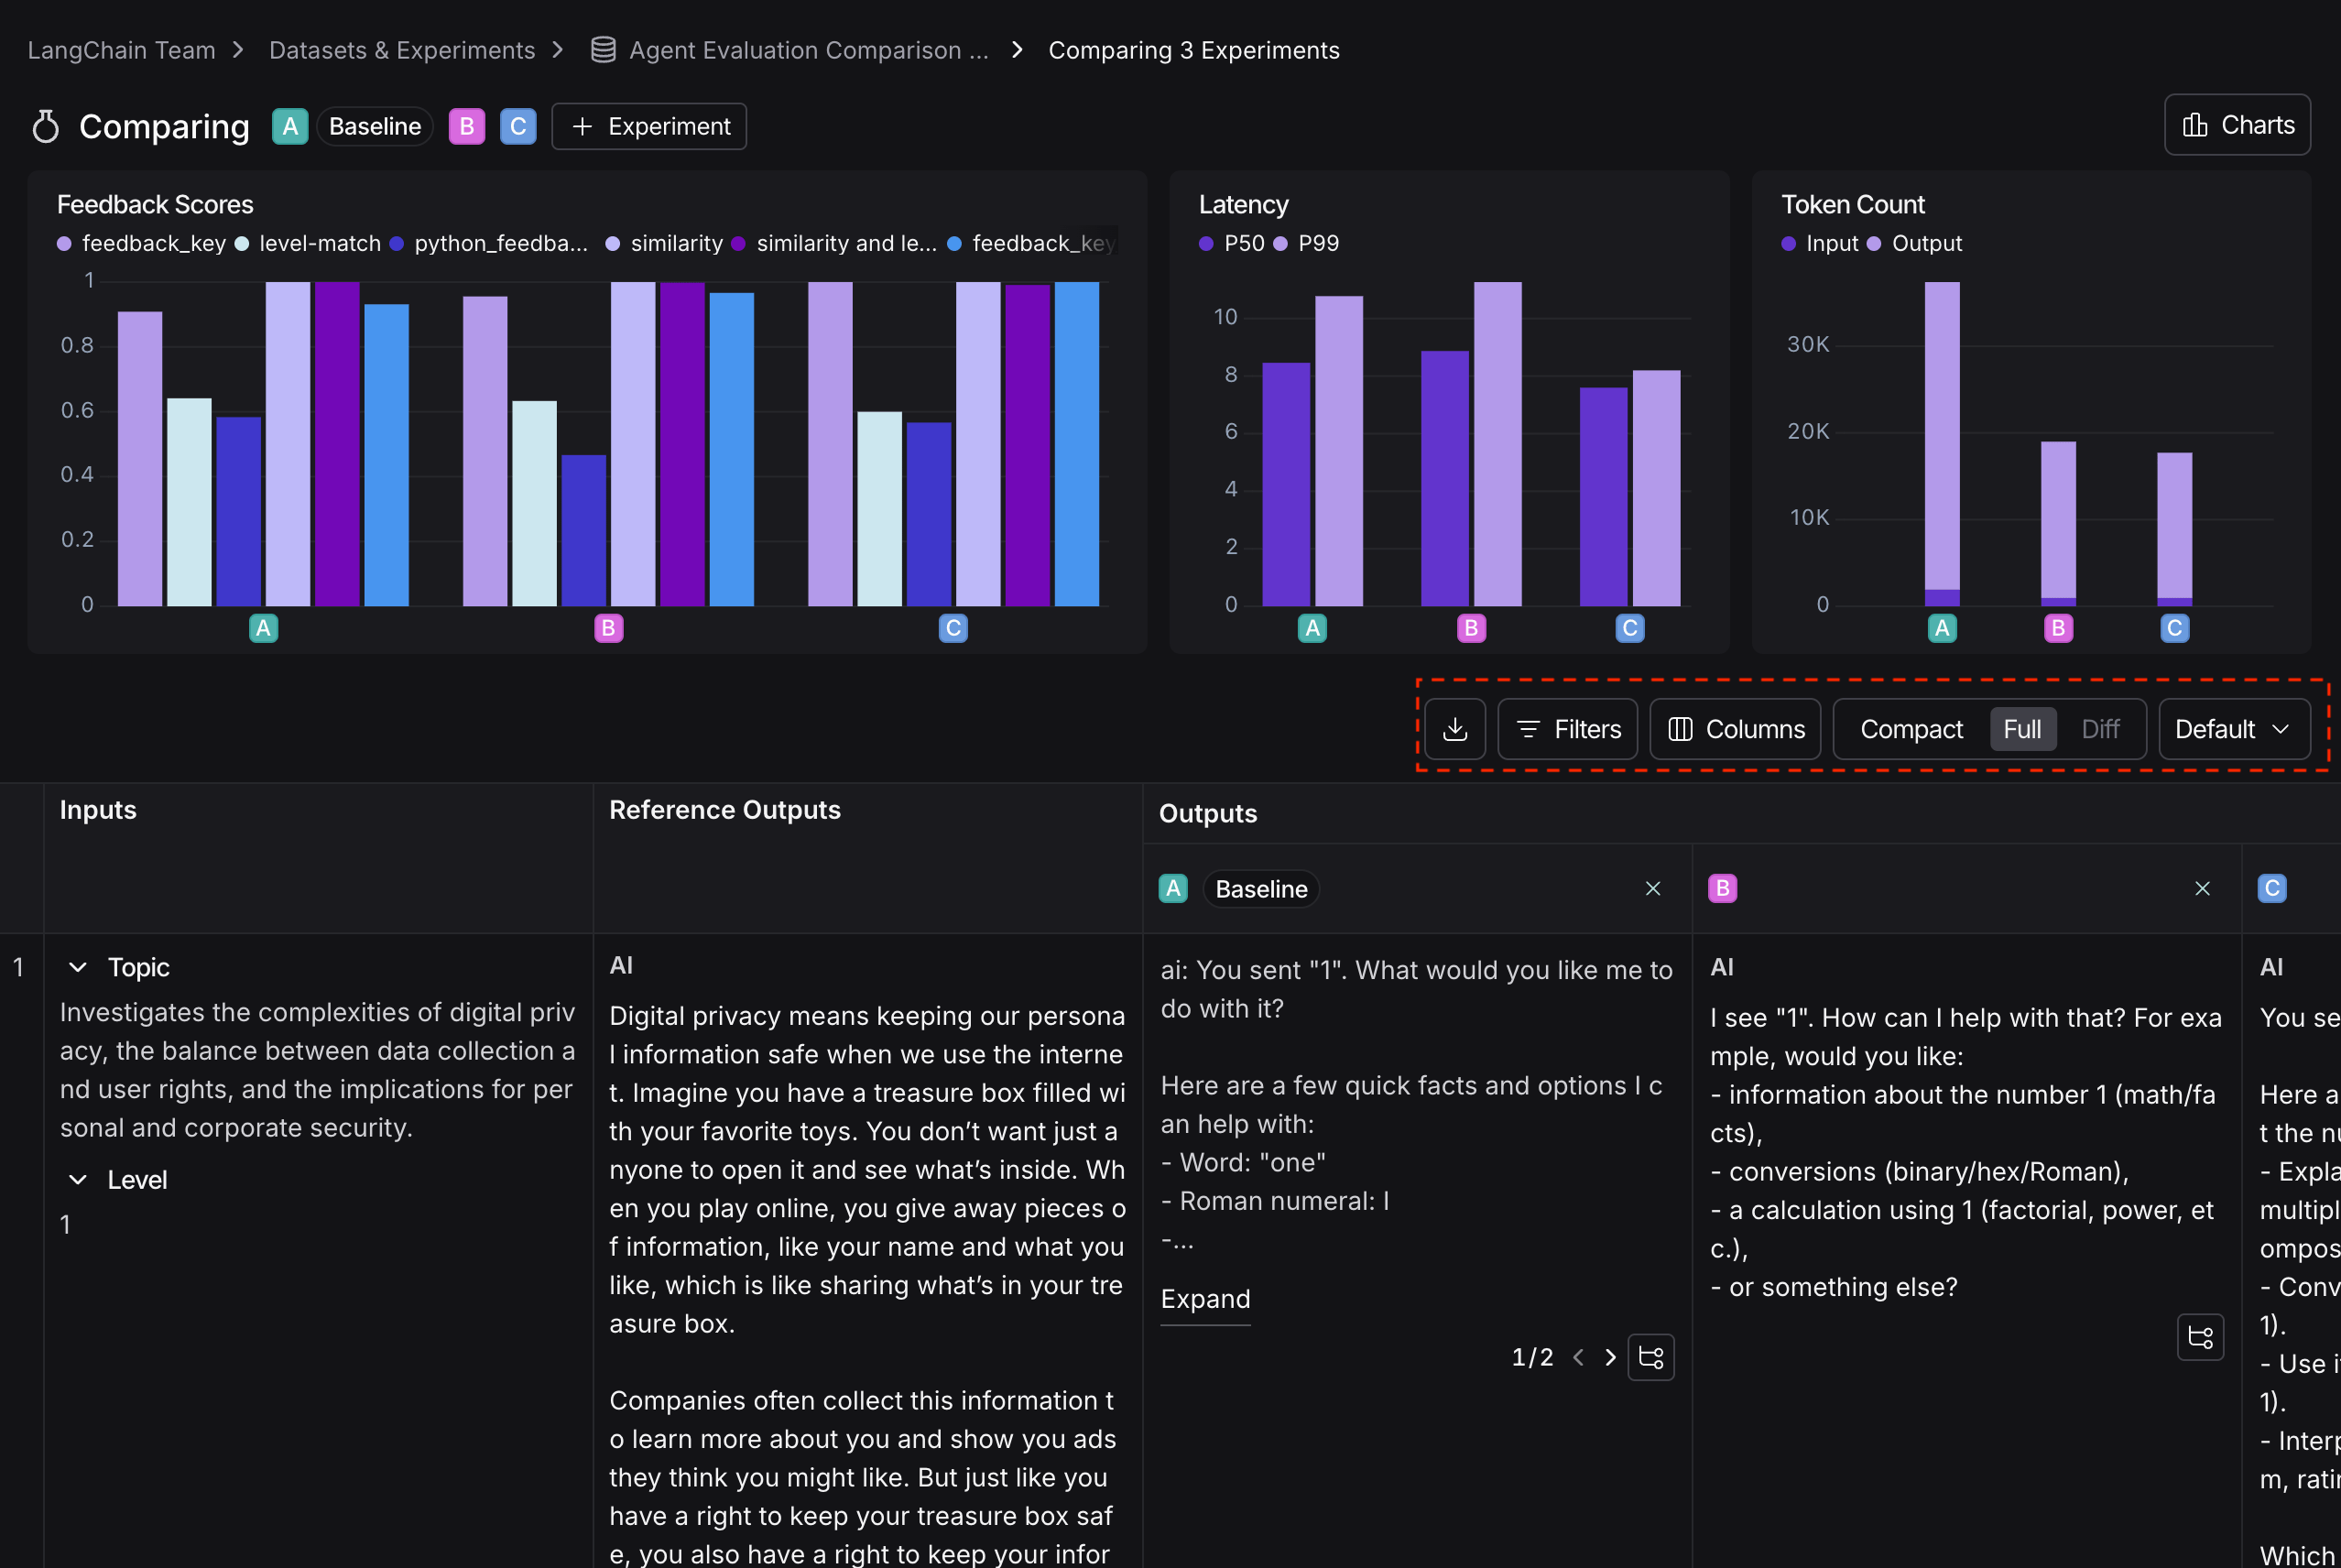
You can toggle between different display options on the right-hand-side bar of the **Comparing Experiments** page.

<div style={{ textAlign: 'center' }}>
  <img className="block dark:hidden" src="https://mintcdn.com/langchain-5e9cc07a-preview-update-1770920925-e15dbde/mxFjzB3ASP1J2dsF/langsmith/images/comparison-table-display-light.png?fit=max&auto=format&n=mxFjzB3ASP1J2dsF&q=85&s=d2b480ce47678eebac0fb753b8a2d420" alt="Table display options, in light mode." width="2560" height="1714" data-path="langsmith/images/comparison-table-display-light.png" />

  <img className="hidden dark:block" src="https://mintcdn.com/langchain-5e9cc07a-preview-update-1770920925-e15dbde/mxFjzB3ASP1J2dsF/langsmith/images/comparison-table-display-dark.png?fit=max&auto=format&n=mxFjzB3ASP1J2dsF&q=85&s=5cc372e452dd3aa43658b6acd02da8d8" alt="Table display options, in dark mode." width="2556" height="1712" data-path="langsmith/images/comparison-table-display-dark.png" />
</div>

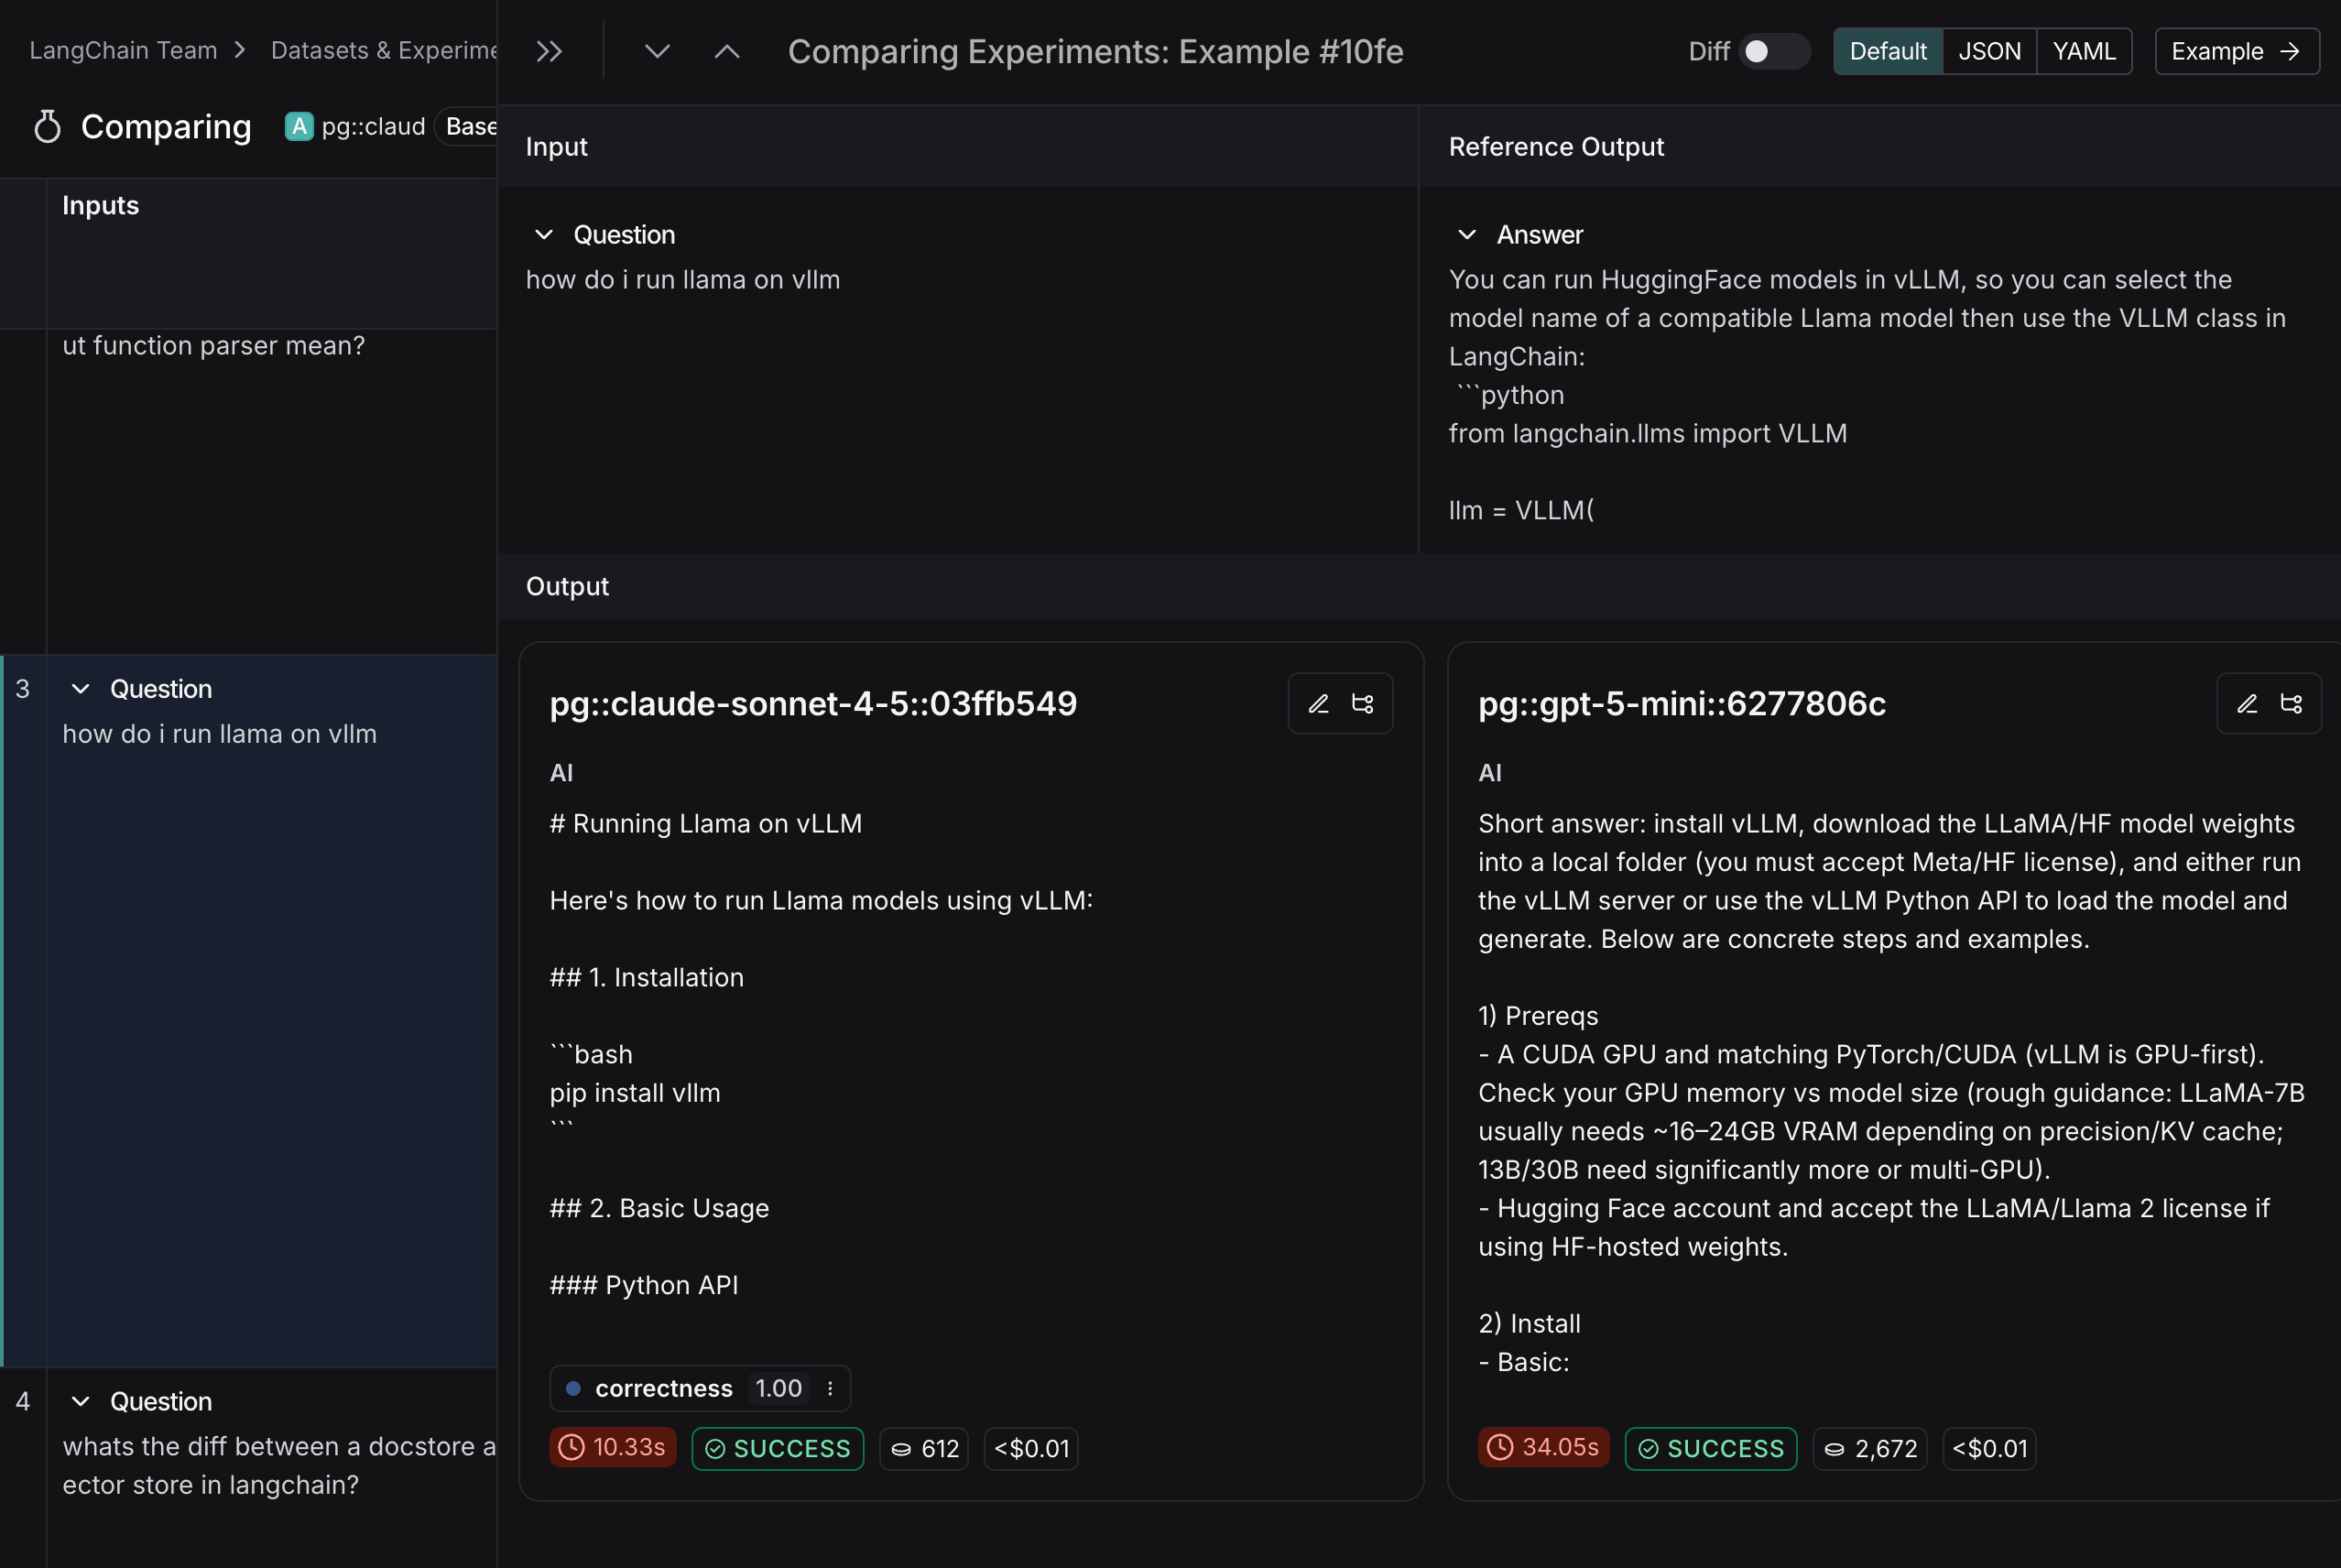
### Filters

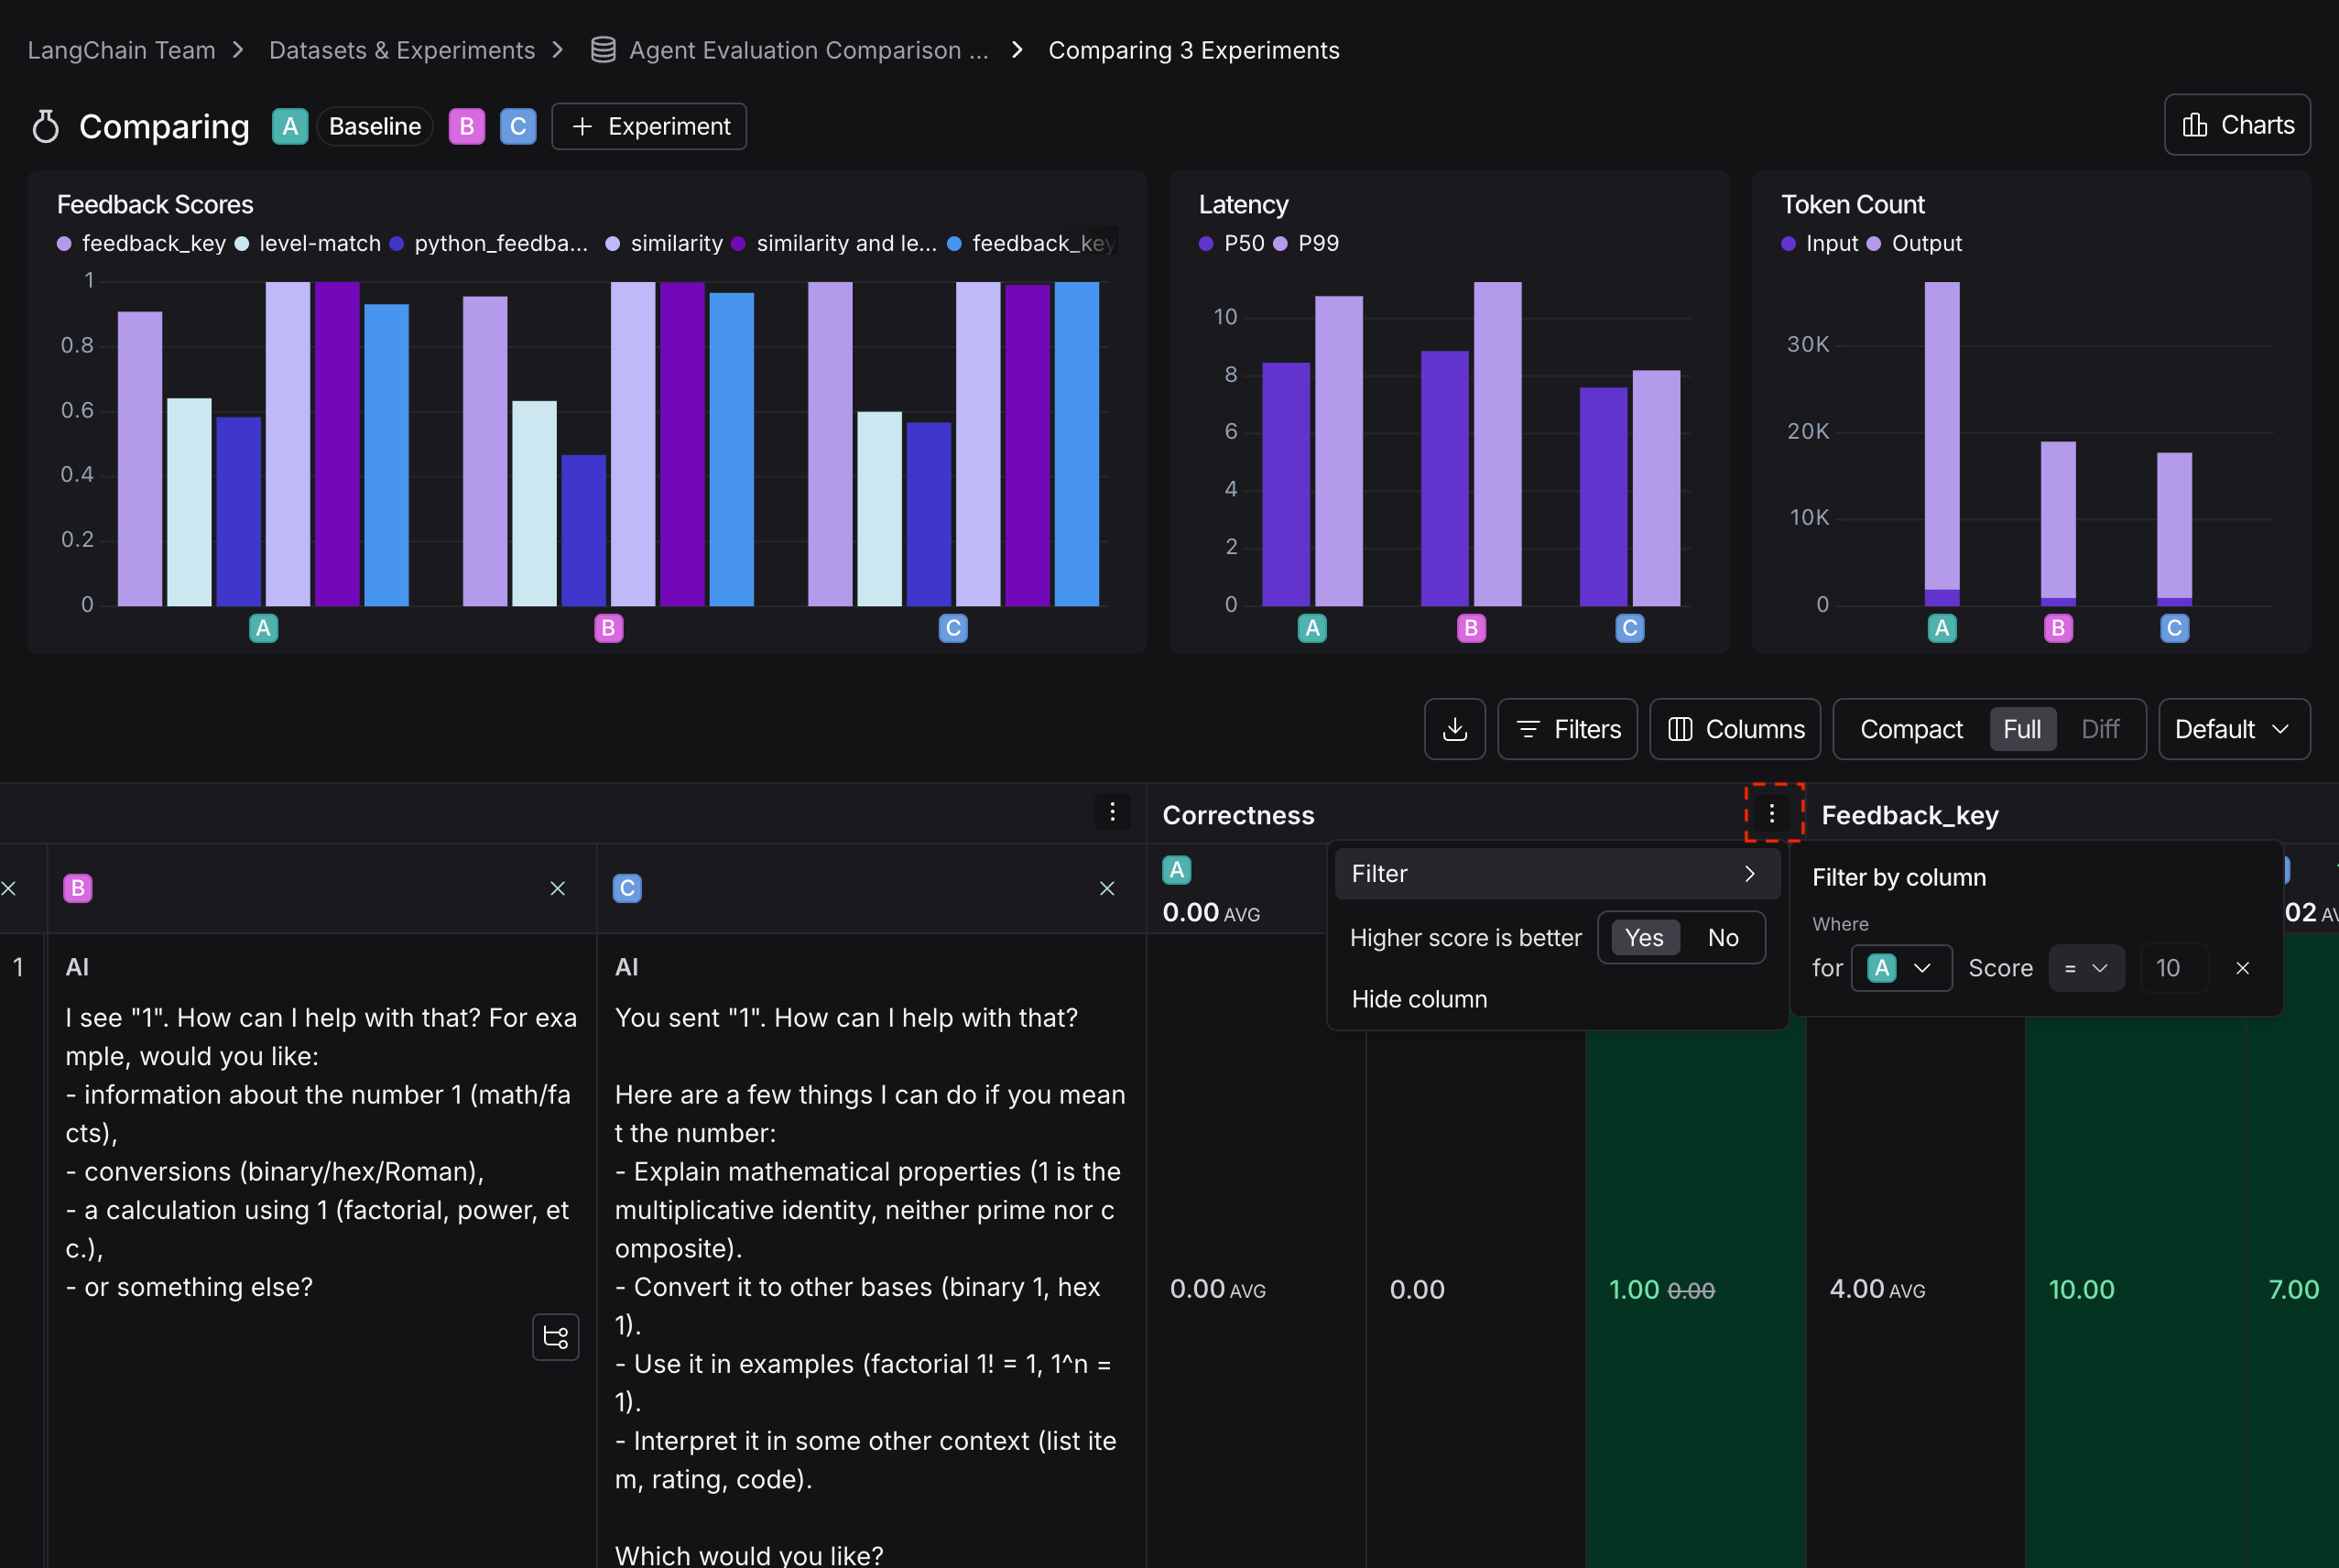
You can apply filters to the experiment comparison view to narrow down specific examples. Common examples for filters include:

* Examples that contain specific `input` / `output`.
* Runs with status `success` or `error`.
* Runs that take more than x seconds in `latency`.
* Specific `metadata`, `tag`, or `feedback`.

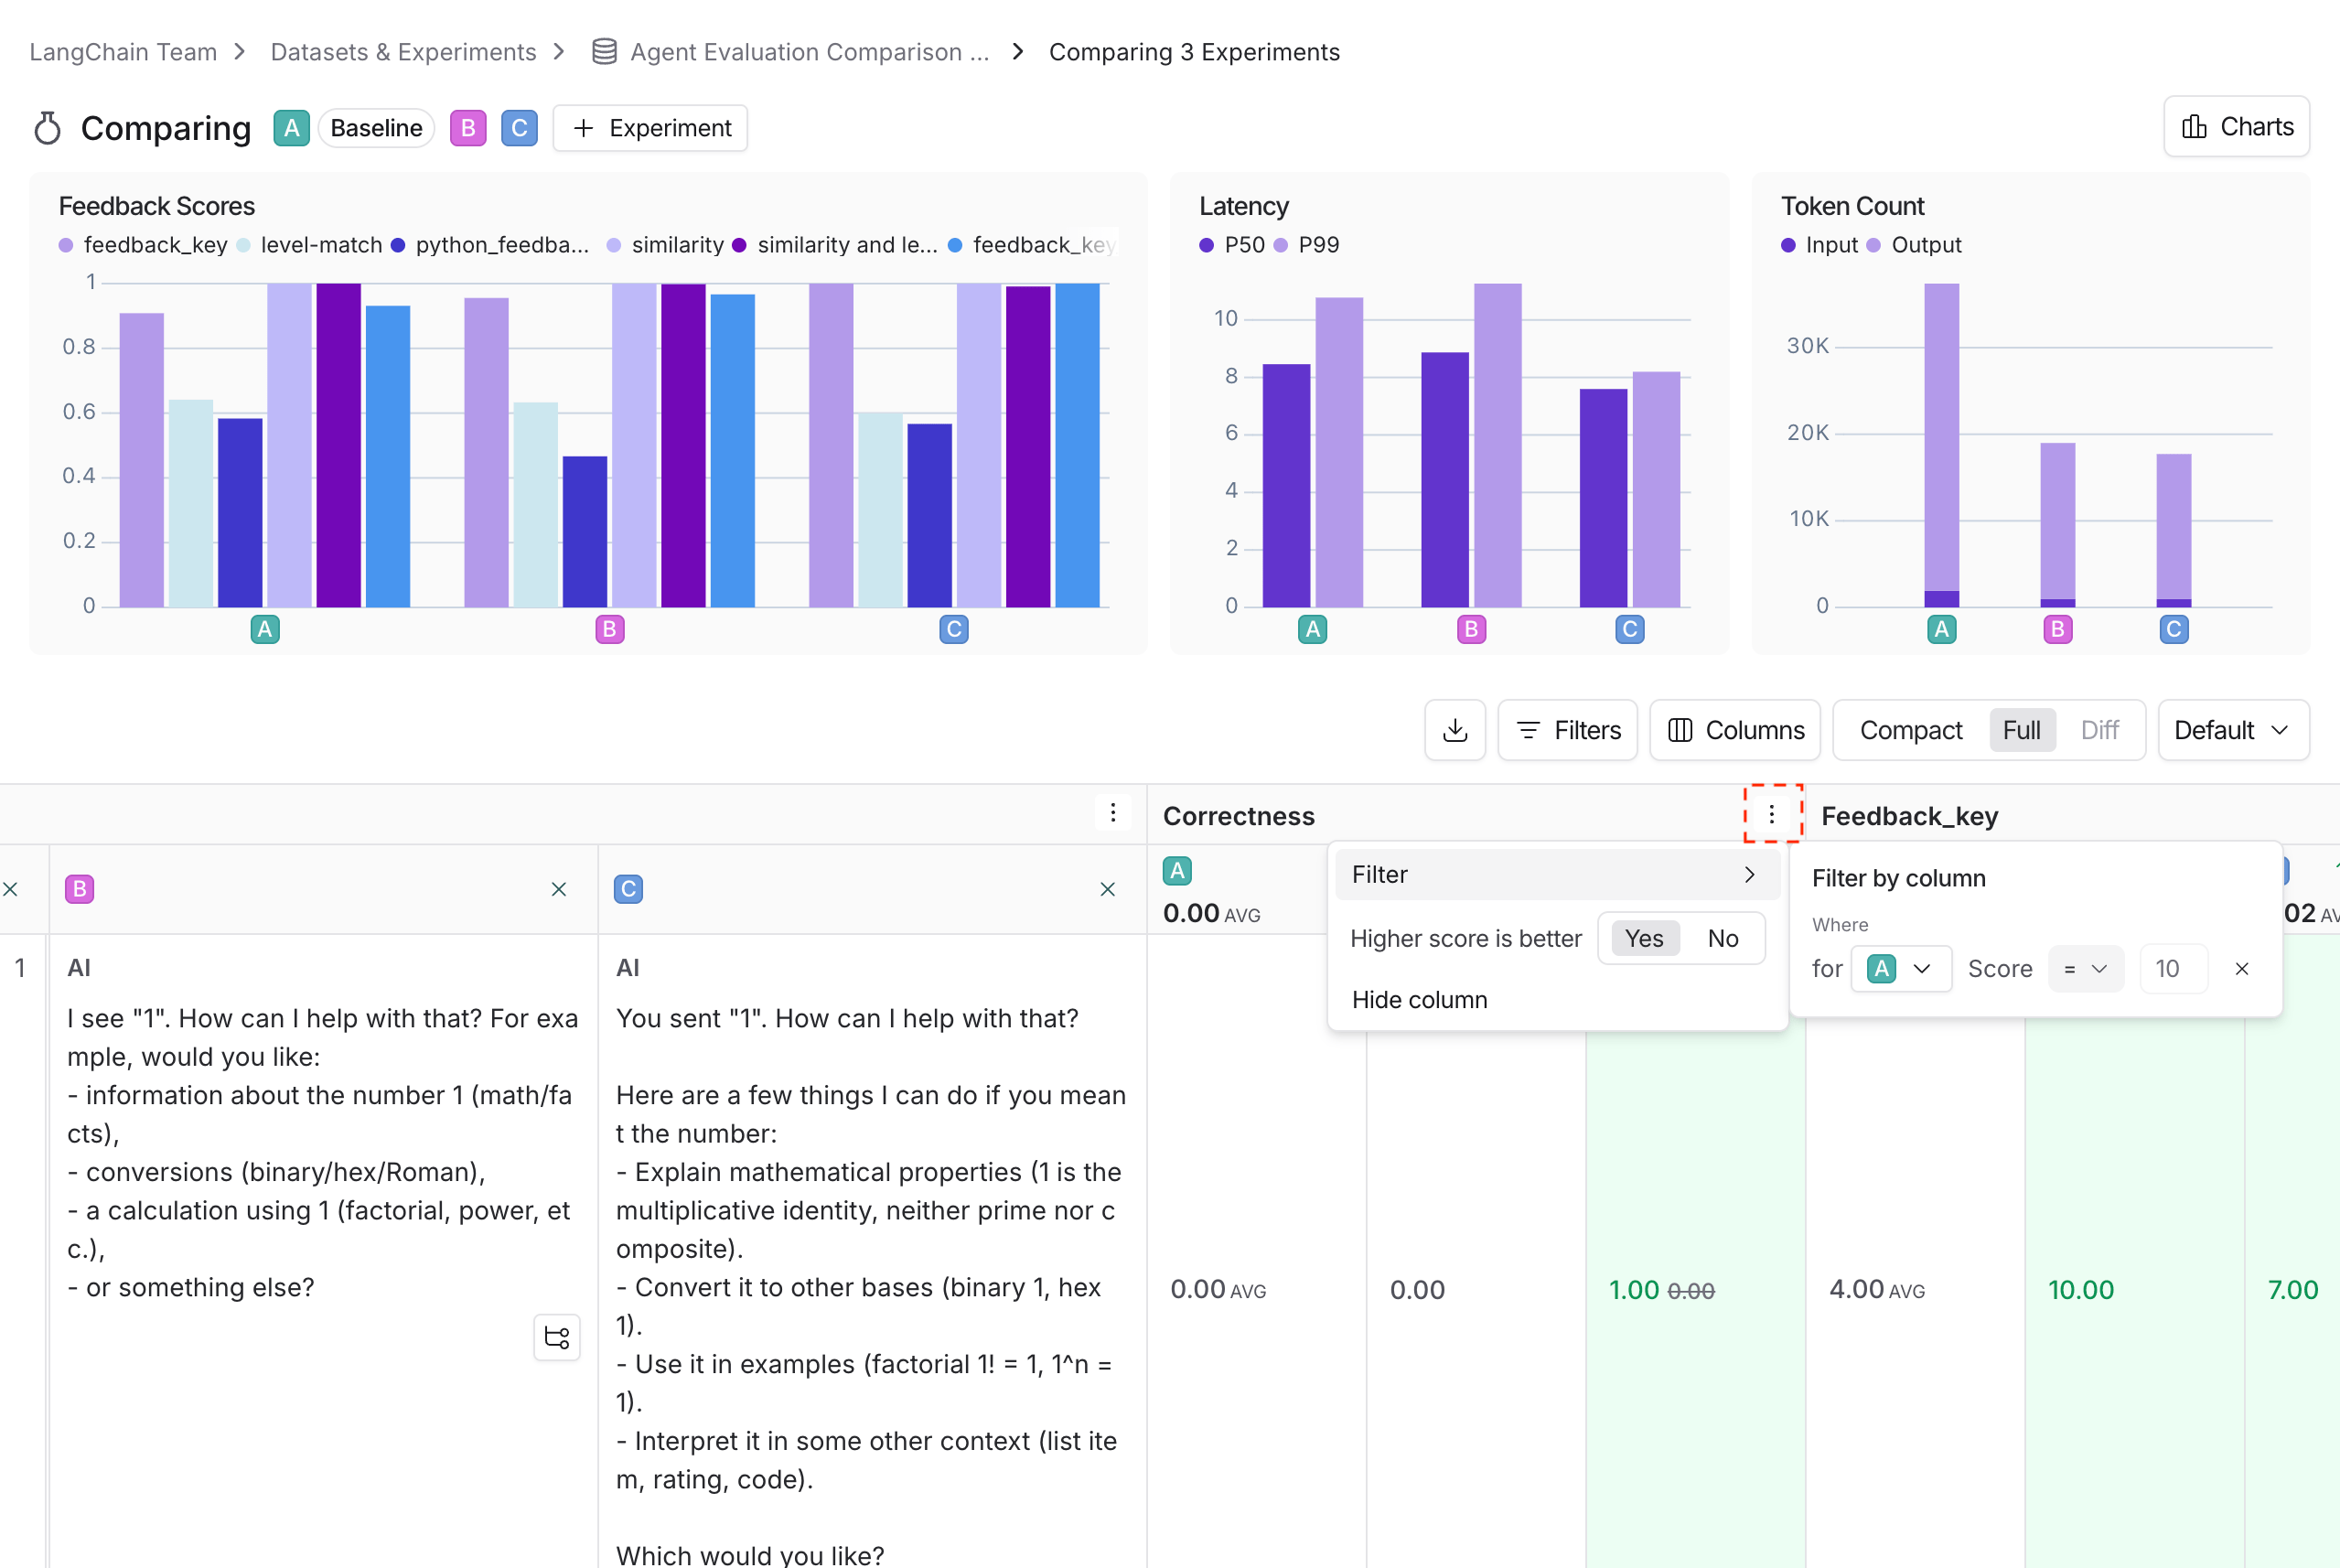
In addition to applying filters on the overall experiment view, you can apply filters on individual columns as well.

<div style={{ textAlign: 'center' }}>
  <img className="block dark:hidden" src="https://mintcdn.com/langchain-5e9cc07a-preview-update-1770920925-e15dbde/5uc5P7xRzXySGIiJ/langsmith/images/column-filter-light.png?fit=max&auto=format&n=5uc5P7xRzXySGIiJ&q=85&s=cf38c68e894e84b0ae87bc8c9538b1bf" alt="Filtering on specific columns, in light mode." width="2558" height="1714" data-path="langsmith/images/column-filter-light.png" />

  <img className="hidden dark:block" src="https://mintcdn.com/langchain-5e9cc07a-preview-update-1770920925-e15dbde/5uc5P7xRzXySGIiJ/langsmith/images/column-filter-dark.png?fit=max&auto=format&n=5uc5P7xRzXySGIiJ&q=85&s=34e1b42deb76e5ee7f6be6e170e25f64" alt="Filtering on specific columns, in dark mode." width="2554" height="1712" data-path="langsmith/images/column-filter-dark.png" />
</div>

### Columns

You can select and hide individual feedback keys or individual metrics in the **Columns** settings to isolate the information you need in the comparison view.

### **Full** vs. **Compact** view

* **Full**: Toggling **Full** will show the full text of the input, output, and reference output for each run. If the output is too long to display in the table, you can click on **Expand** to view the full content.
* **Compact**: **Compact** view displays a preview of the experiment results for each example.

### Display types

There are three built-in experiment views that cover several display types: **Default**, **YAML**, **JSON**.

## View regressions and improvements

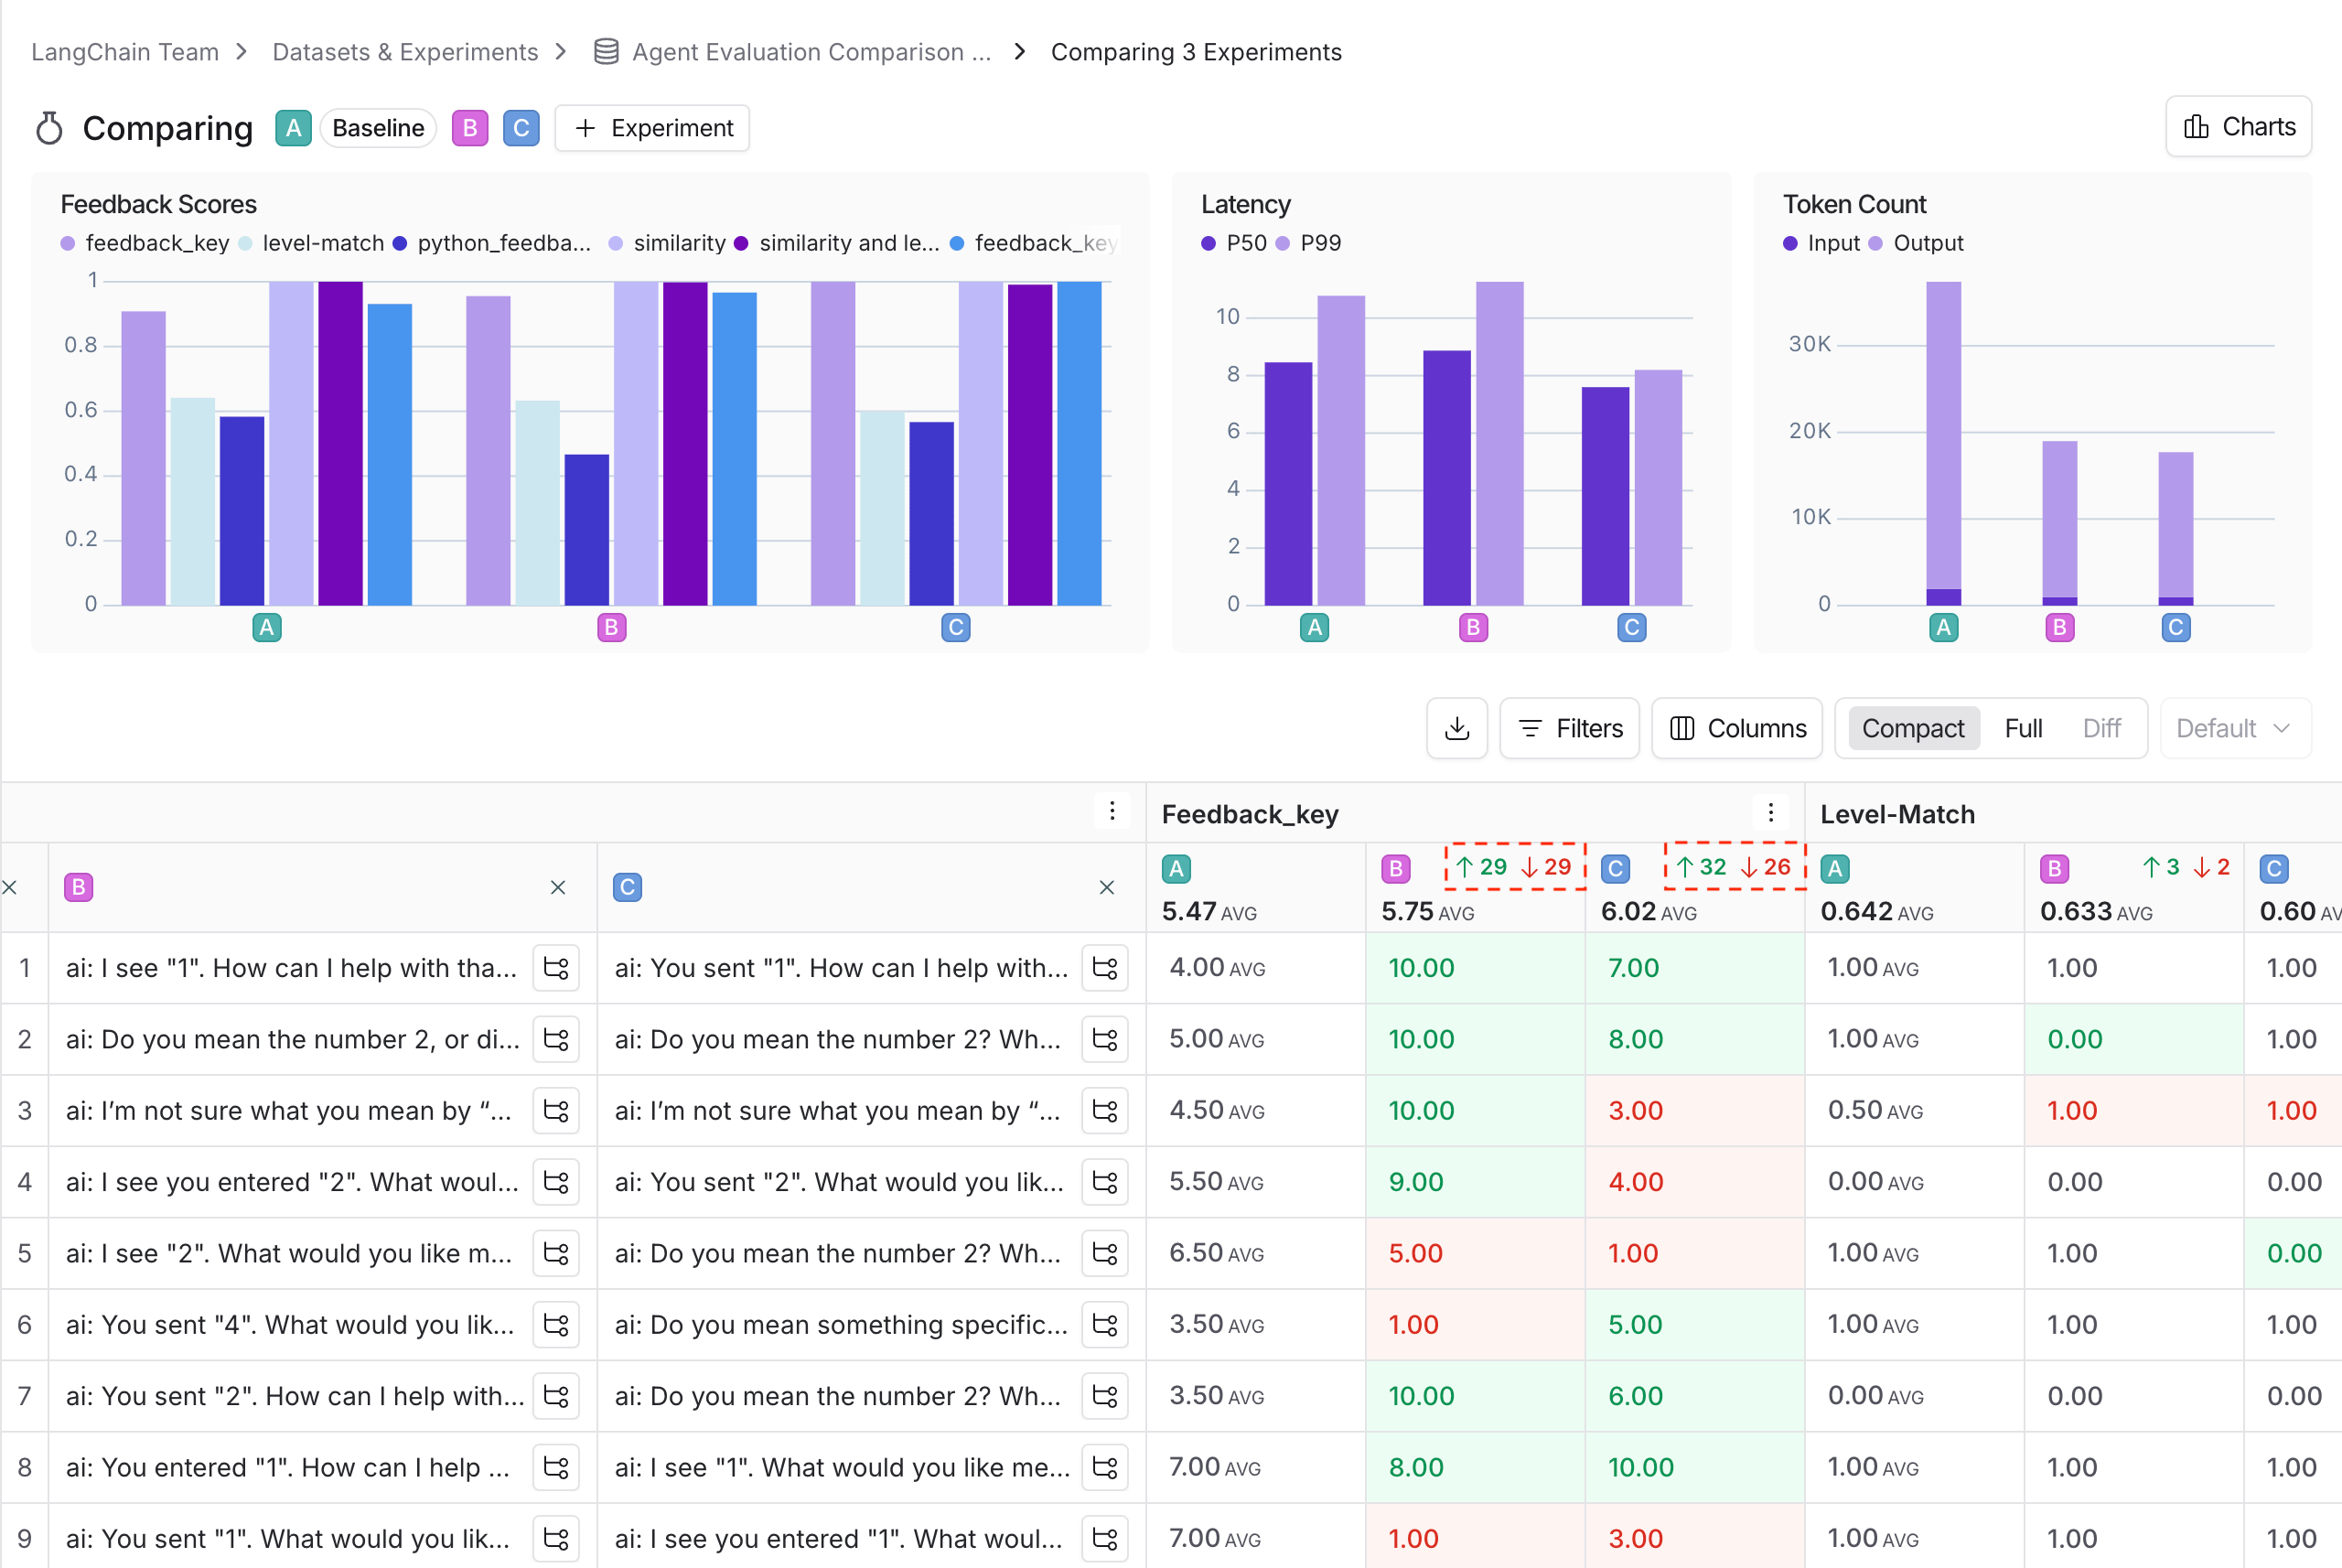
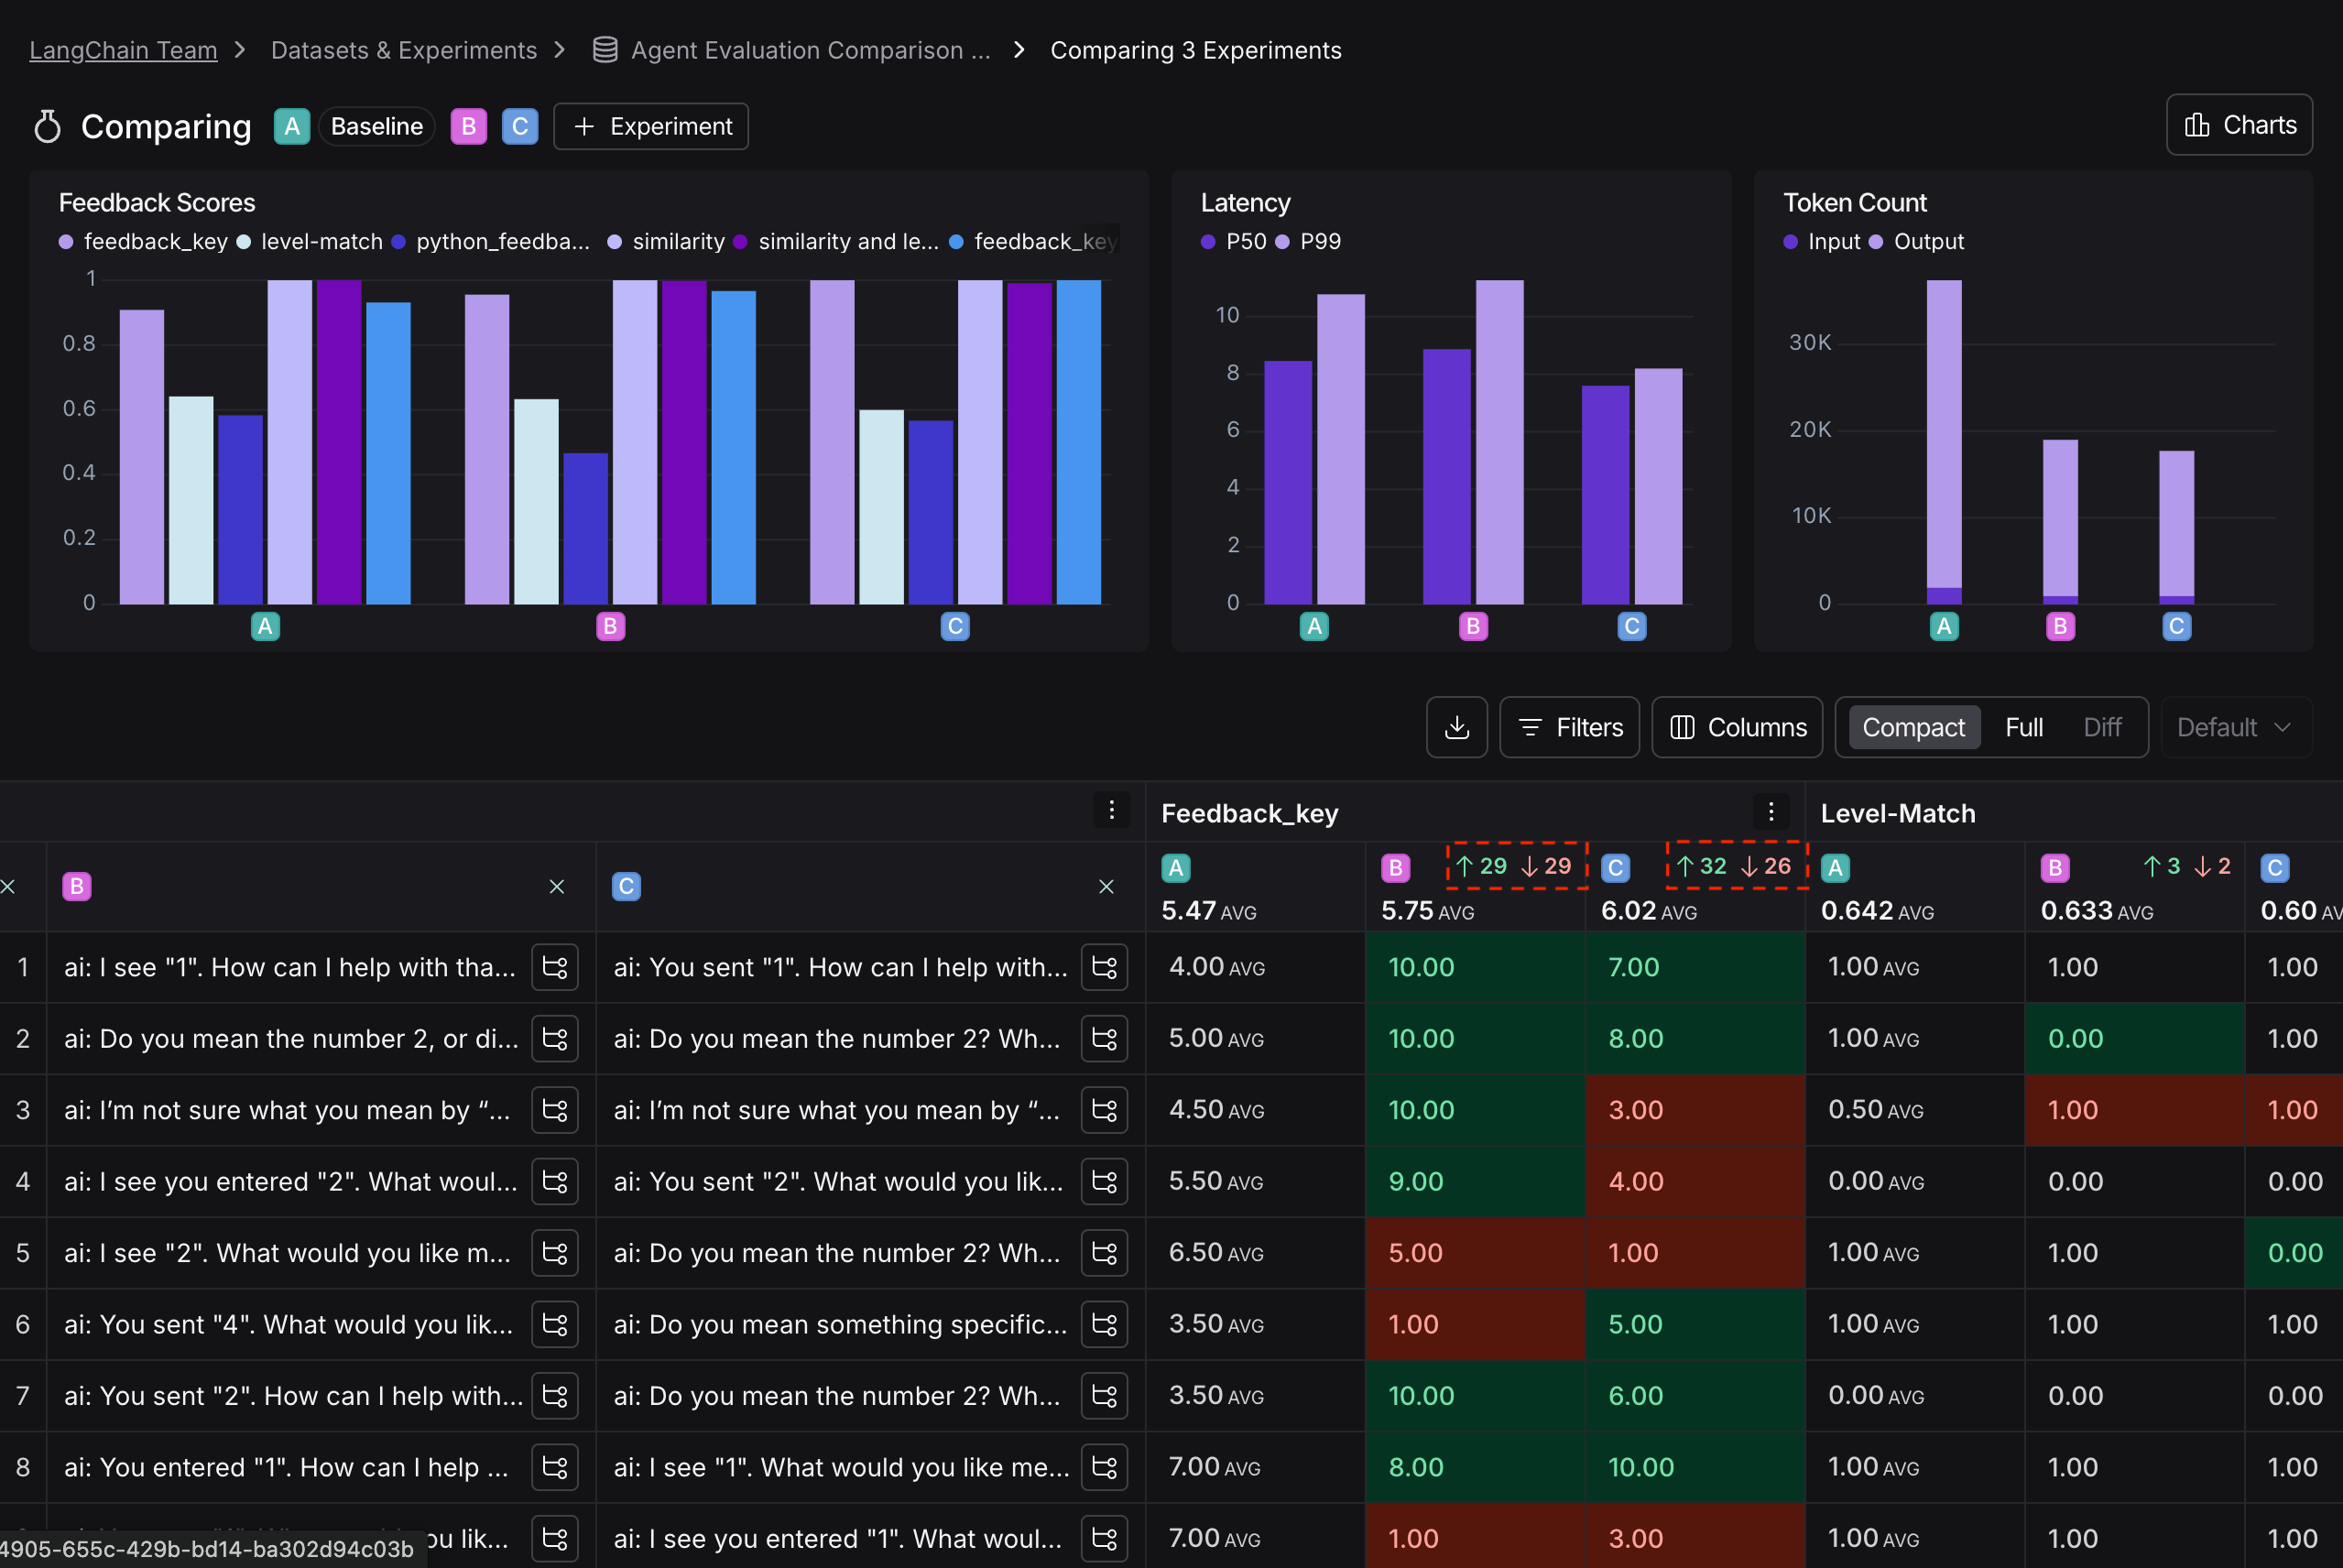
In the comparison view, runs that *regressed* on any feedback key against your baseline experiment will be highlighted in red, while runs that *improved* will be highlighted in green. At the top of each feedback column, you can find how many runs in that experiment did better and how many did worse than your baseline experiment.

Click on the regressions or improvements buttons on the top of each column to filter to the runs that regressed or improved in that specific experiment.

<div style={{ textAlign: 'center' }}>
  <img className="block dark:hidden" src="https://mintcdn.com/langchain-5e9cc07a-preview-update-1770920925-e15dbde/32MELmiBhEVyGMA3/langsmith/images/regression-view-light.png?fit=max&auto=format&n=32MELmiBhEVyGMA3&q=85&s=cb1e47503a31a96b37d8aec603e0f672" alt="The comparison view comparing 3 experiments with the regressions and improvements highlighted in red and green respectively, in light mode." width="2560" height="1714" data-path="langsmith/images/regression-view-light.png" />

  <img className="hidden dark:block" src="https://mintcdn.com/langchain-5e9cc07a-preview-update-1770920925-e15dbde/32MELmiBhEVyGMA3/langsmith/images/regression-view-dark.png?fit=max&auto=format&n=32MELmiBhEVyGMA3&q=85&s=c762f9f6a97a64167d1f92b7c93c1f93" alt="The comparison view comparing 3 experiments with the regressions and improvements highlighted in red and green respectively, in dark mode." width="2558" height="1712" data-path="langsmith/images/regression-view-dark.png" />
</div>

## View side-by-side diffs

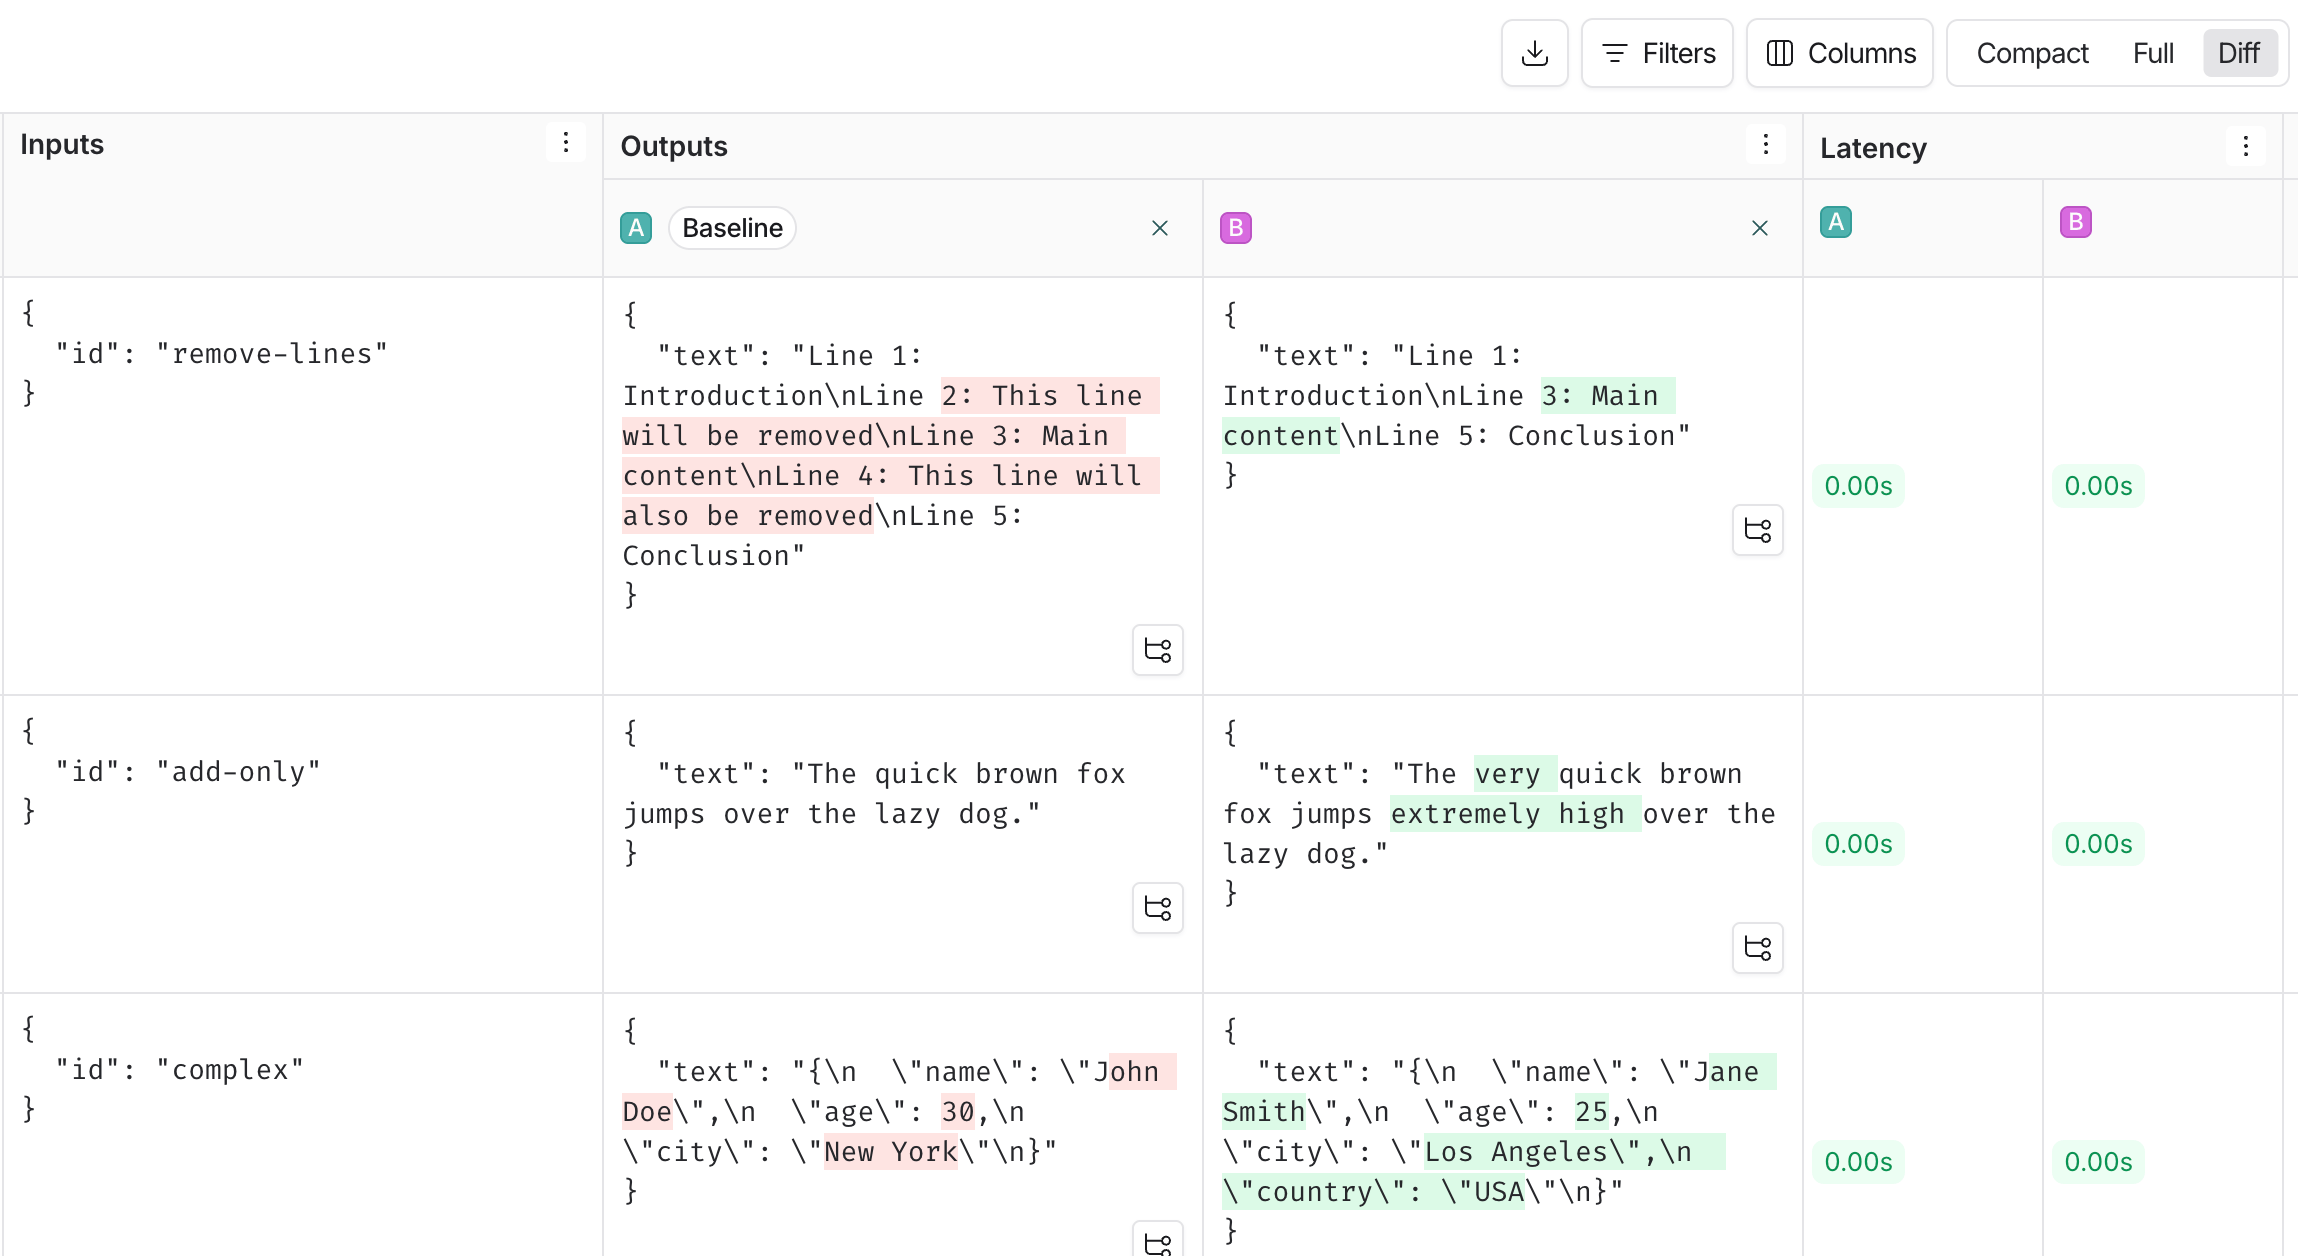
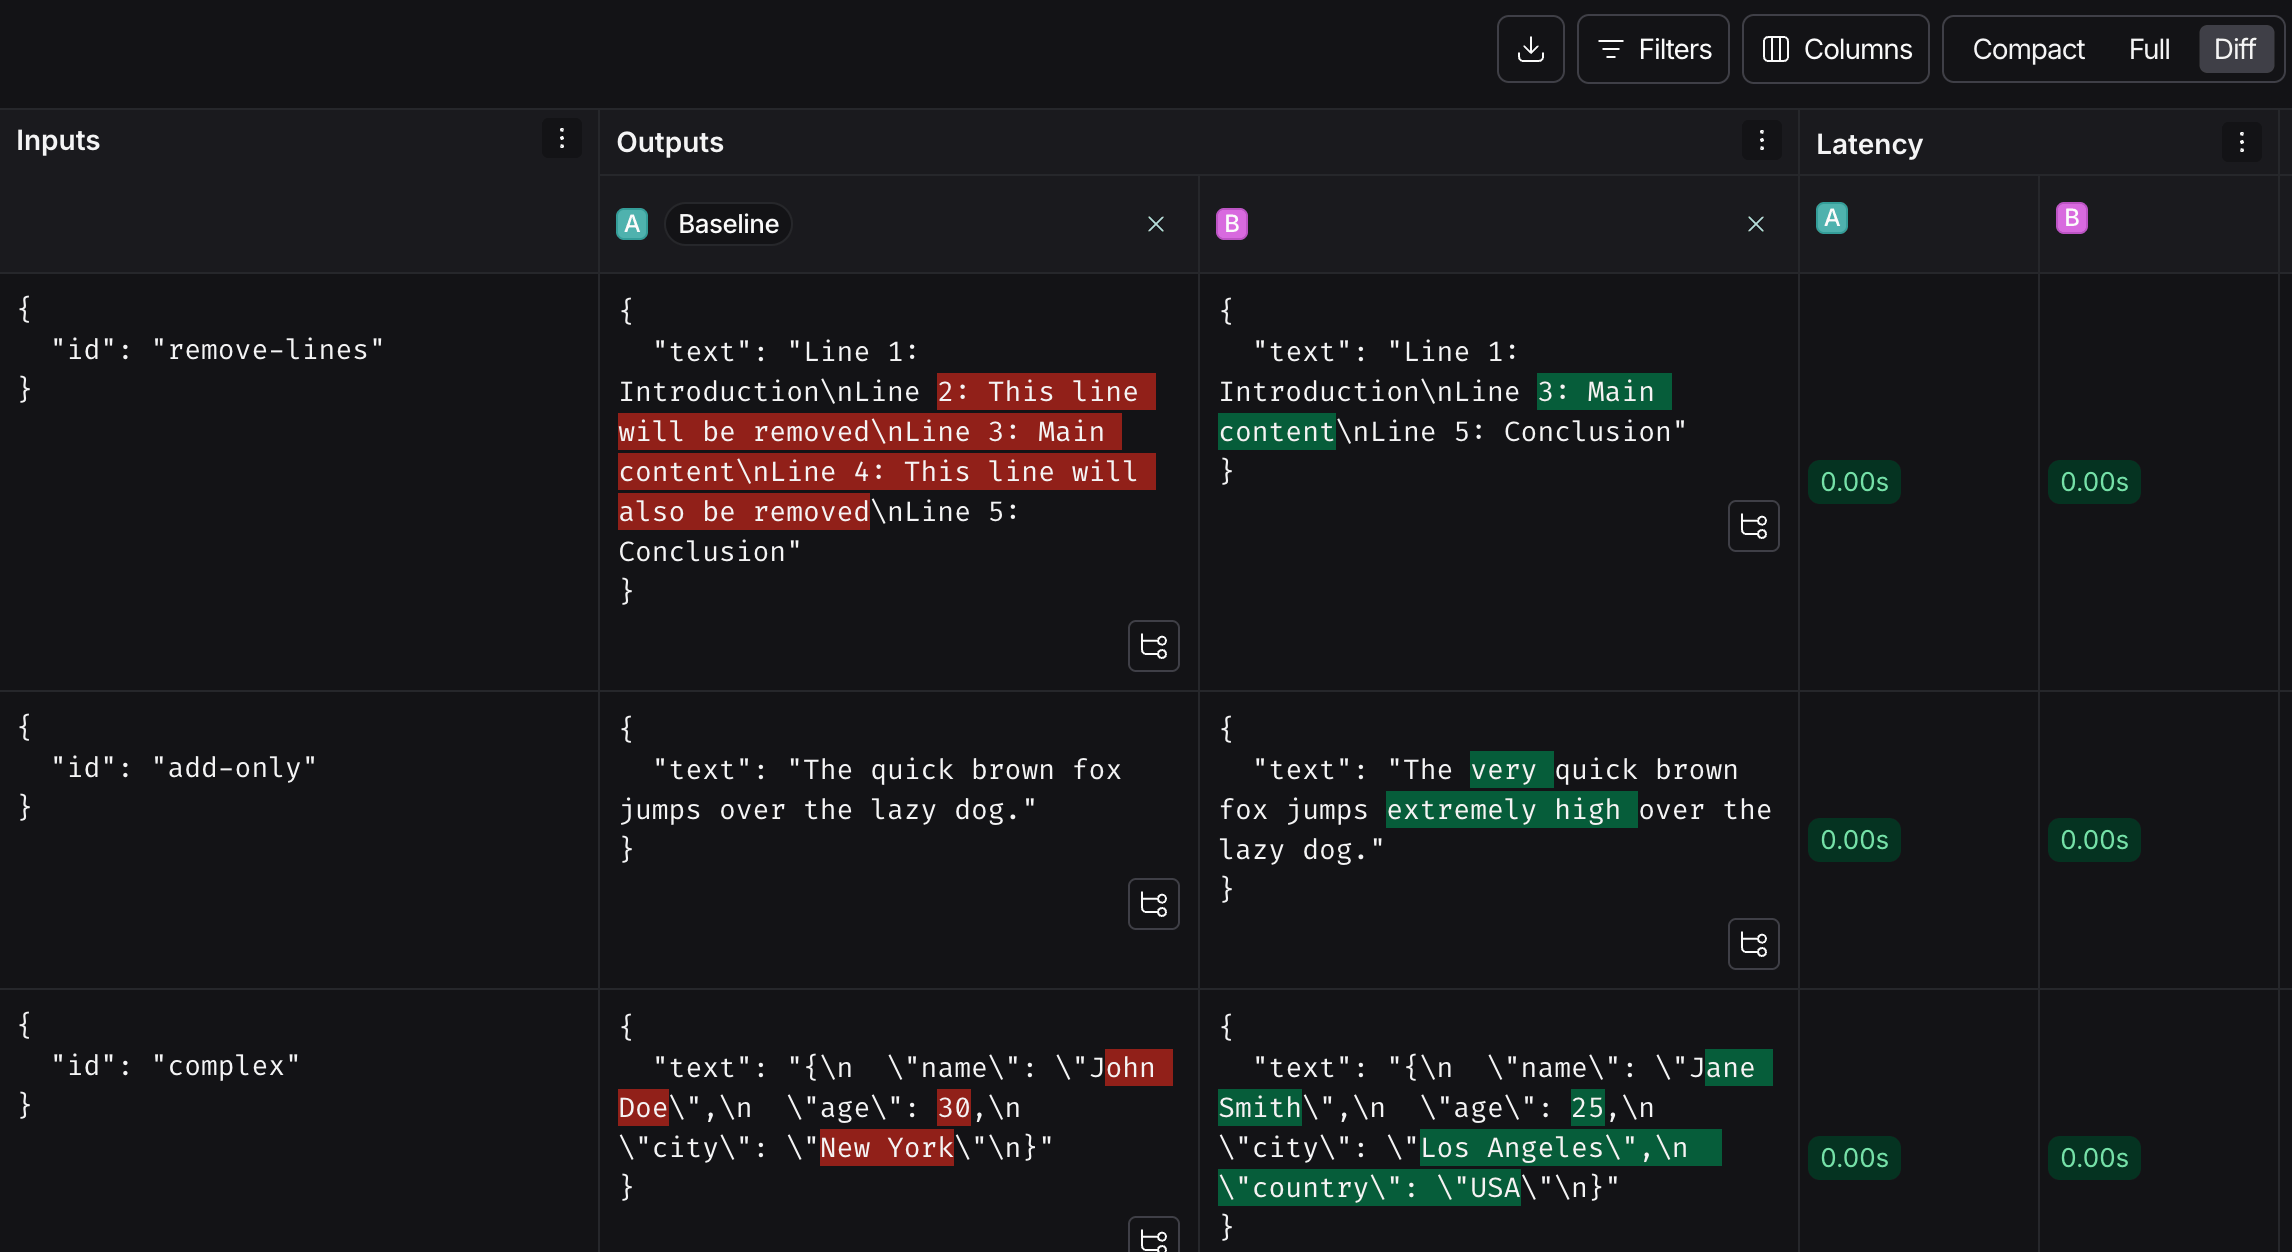
When comparing two experiments, for JSON and YAML display styles, you can toggle on the experiment diff mode to compare experiment outputs. The diff mode highlights modifications between outputs, and can be particularly useful for structured output comparisons.

<div style={{ textAlign: 'center' }}>
  <img className="block dark:hidden" src="https://mintcdn.com/langchain-5e9cc07a-preview-update-1770920925-e15dbde/5uc5P7xRzXySGIiJ/langsmith/images/comparison-diff-view-light.png?fit=max&auto=format&n=5uc5P7xRzXySGIiJ&q=85&s=63e853d411ca92c17c909840a679a855" alt="The comparison diff mode in light." width="2298" height="1256" data-path="langsmith/images/comparison-diff-view-light.png" />

  <img className="hidden dark:block" src="https://mintcdn.com/langchain-5e9cc07a-preview-update-1770920925-e15dbde/5uc5P7xRzXySGIiJ/langsmith/images/comparison-diff-view-dark.png?fit=max&auto=format&n=5uc5P7xRzXySGIiJ&q=85&s=e98755692302660bfcfc2834923a732d" alt="The comparison diff mode in dark." width="2292" height="1252" data-path="langsmith/images/comparison-diff-view-dark.png" />
</div>

## Update baseline experiment and metric

To track regressions across experiments, you can:

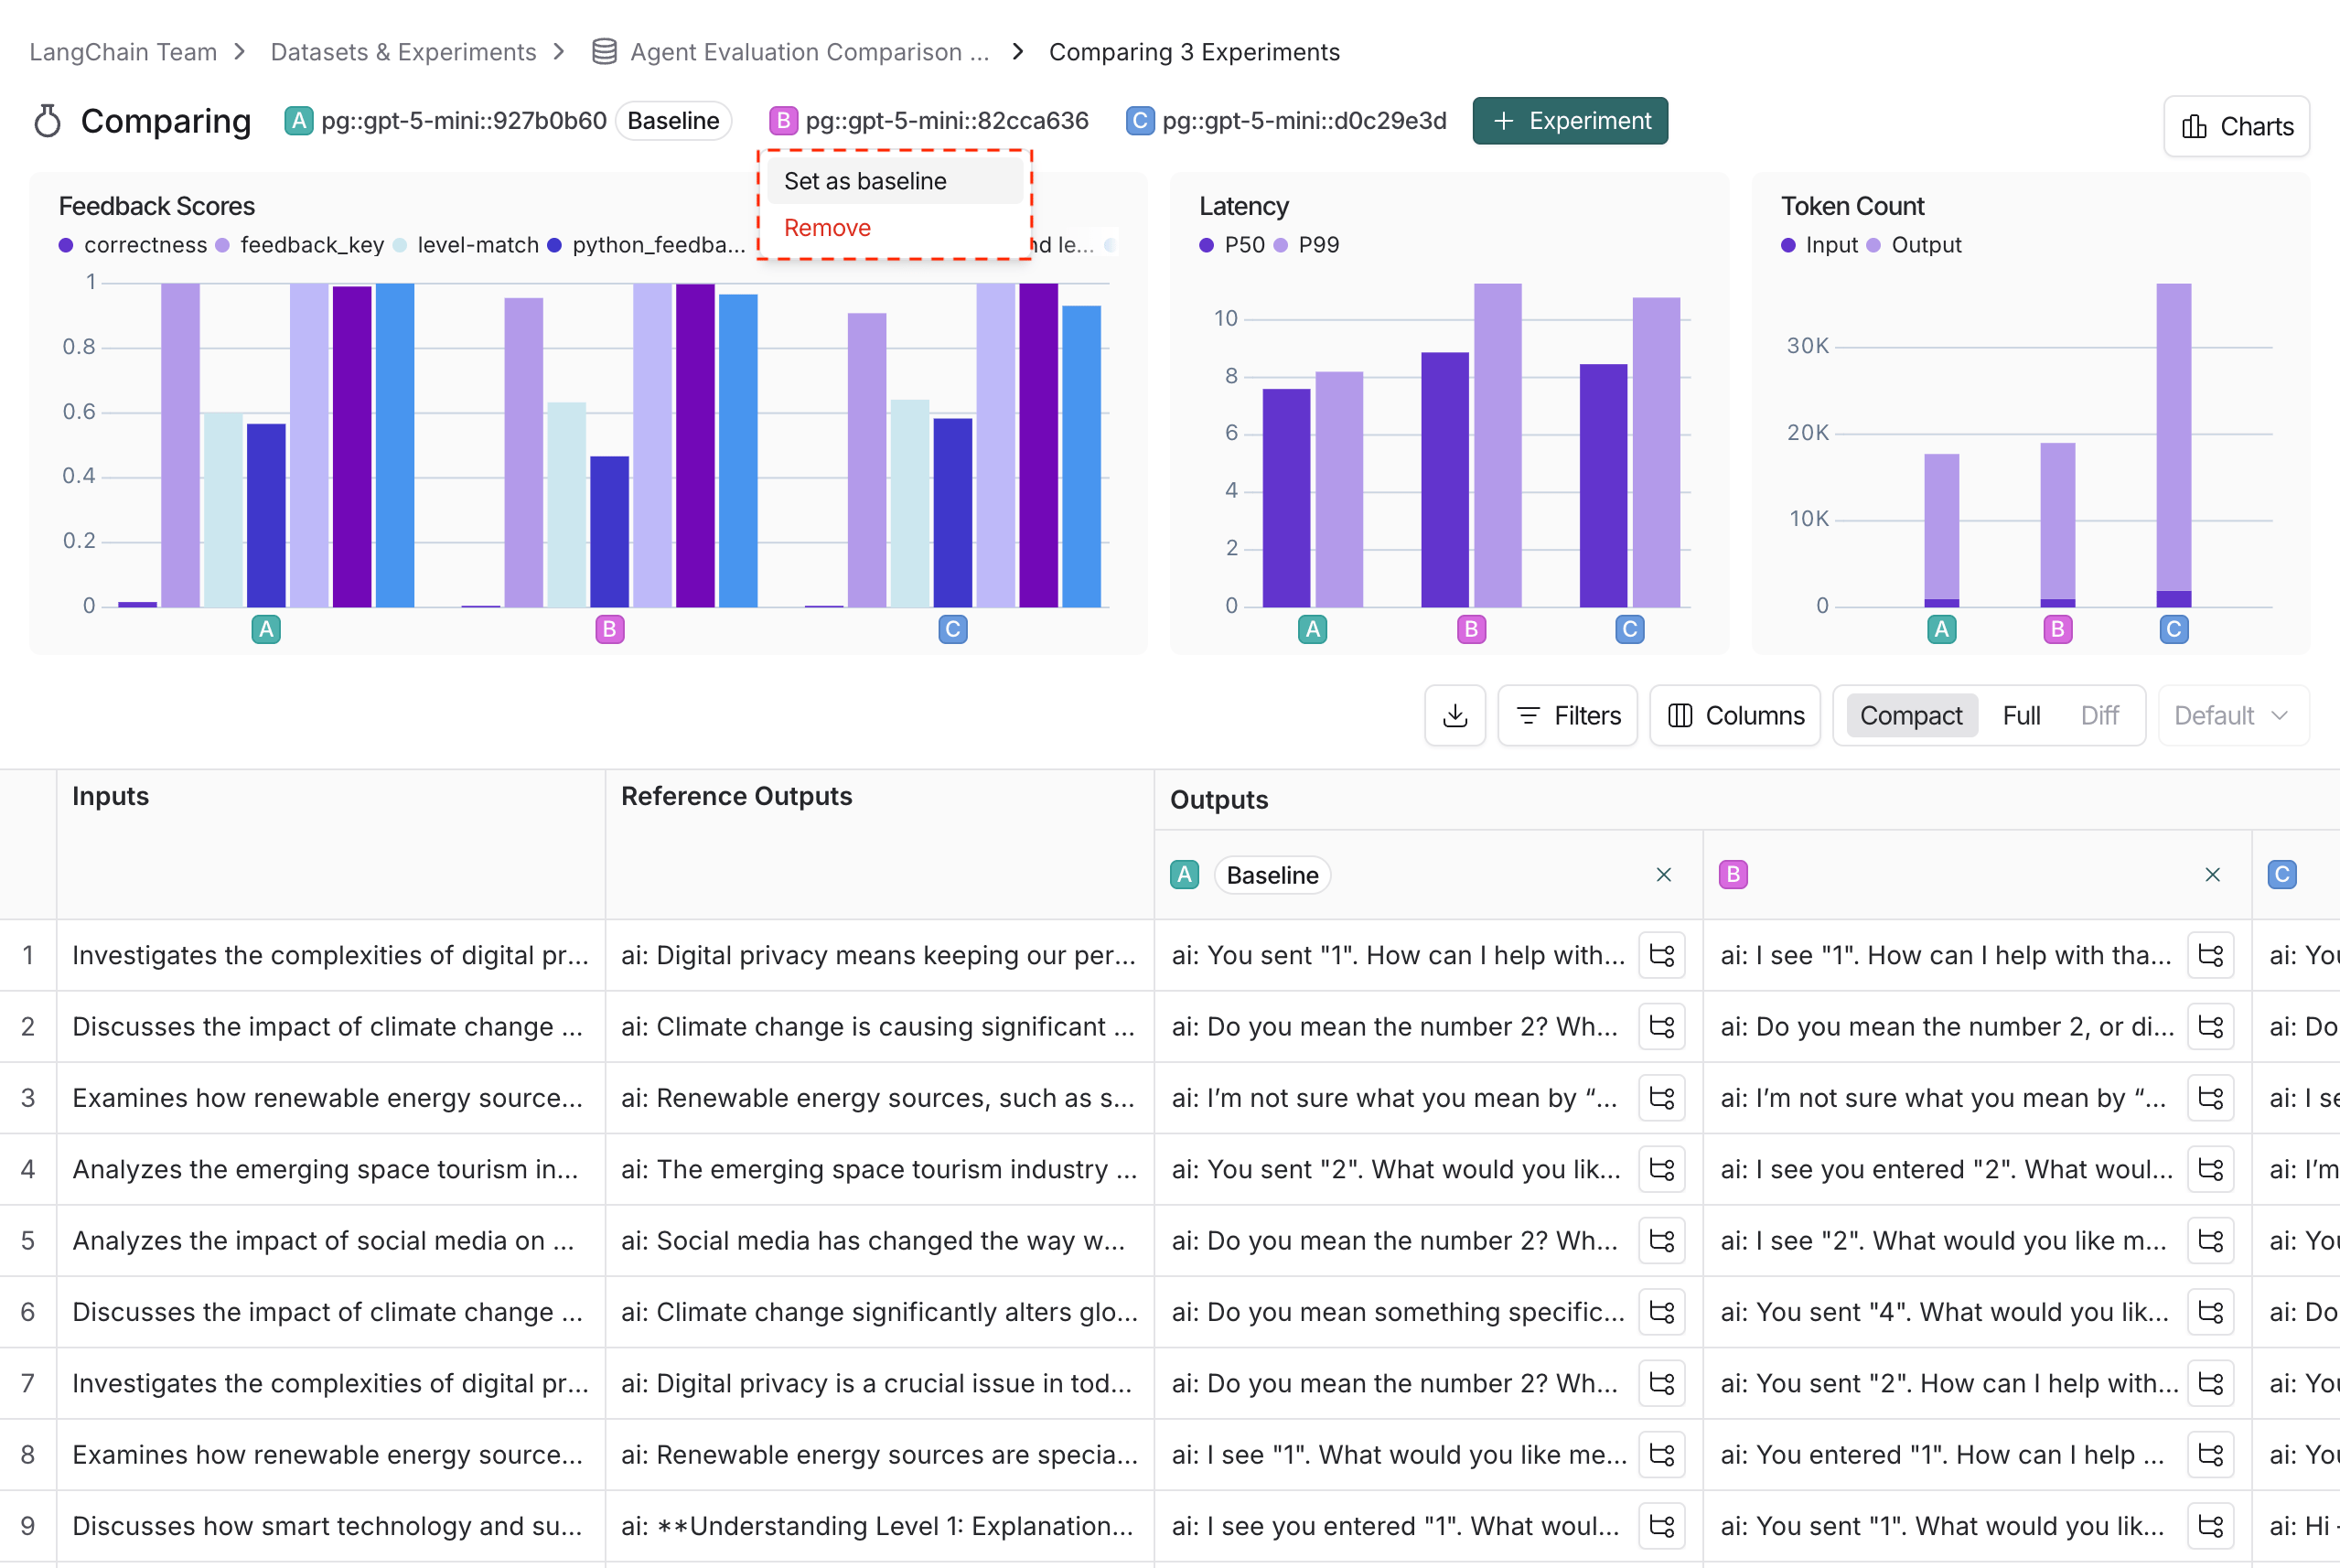
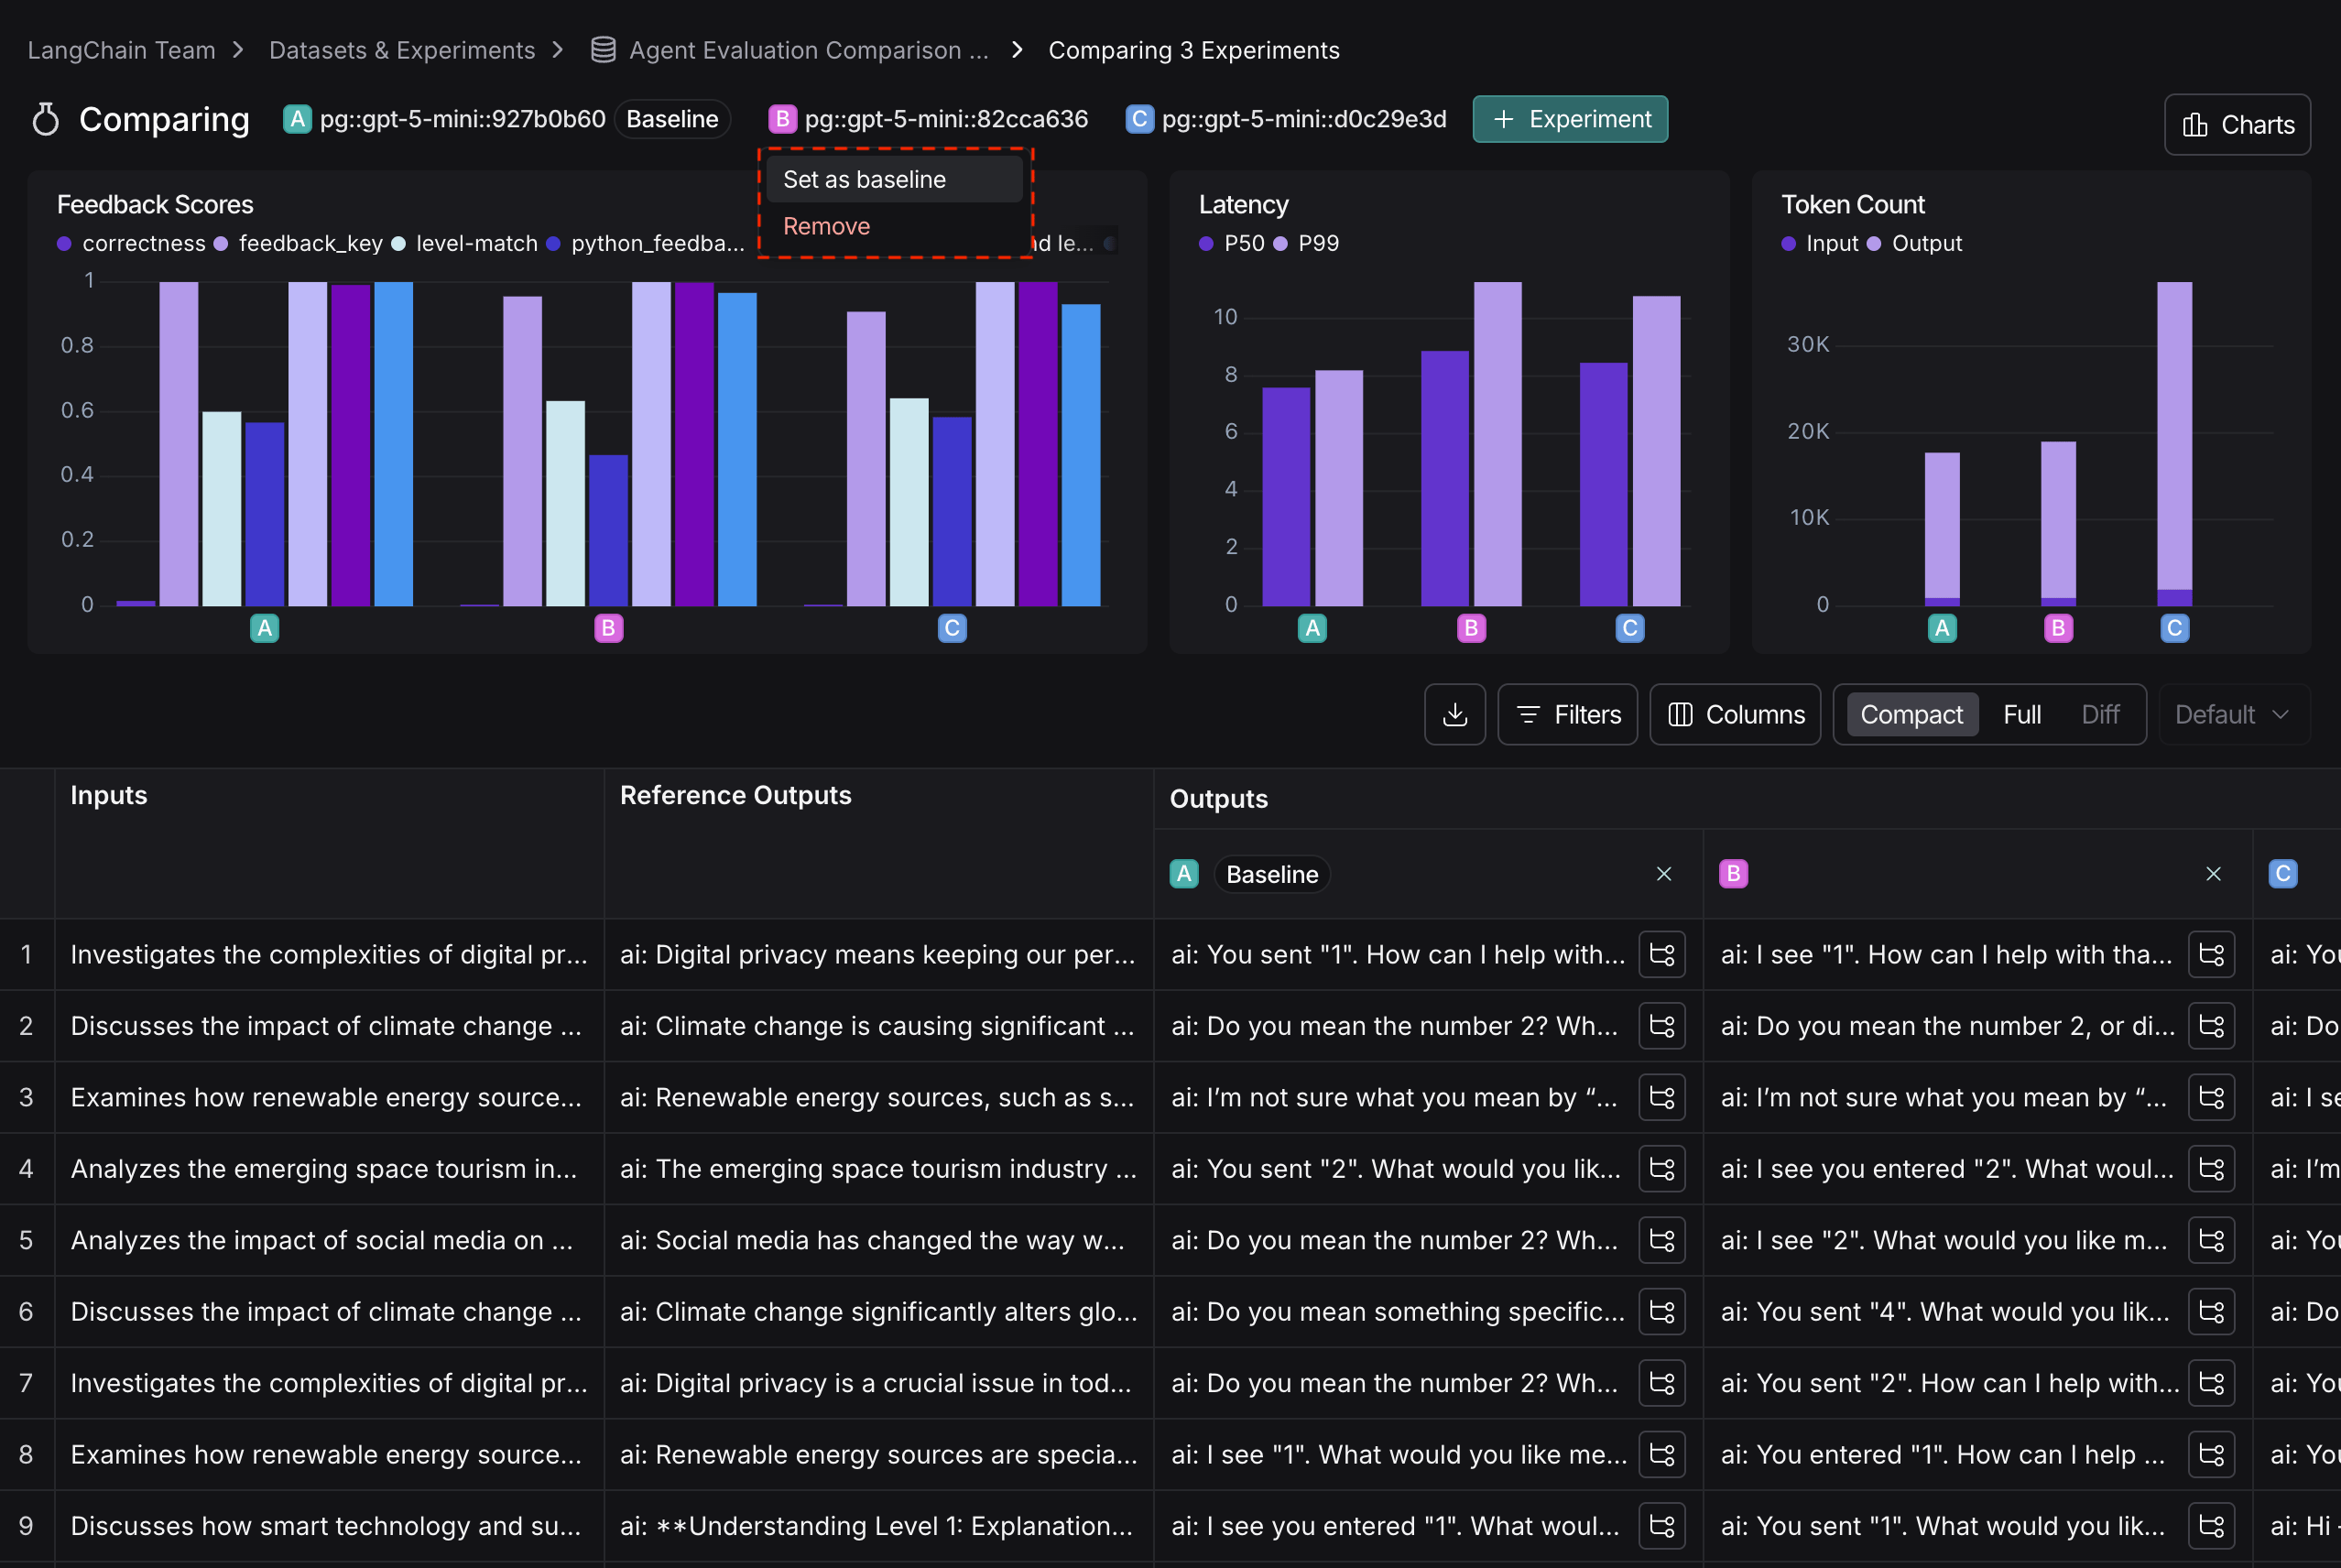
1. At the top of the comparison view, hovering over the experiment icons, you can select any of the experiments as the **Baseline** to be compared against. You can also add or remove experiments. By default, the first selected experiment is selected as the baseline.

<div style={{ textAlign: 'center' }}>
  <img className="block dark:hidden" src="https://mintcdn.com/langchain-5e9cc07a-preview-update-1770920925-e15dbde/5uc5P7xRzXySGIiJ/langsmith/images/comparison-baseline-light.png?fit=max&auto=format&n=5uc5P7xRzXySGIiJ&q=85&s=d6b725cd5f4fb081330a58322714eab1" alt="Configuring baseline experiment in dropdown, in light mode." width="2558" height="1714" data-path="langsmith/images/comparison-baseline-light.png" />

  <img className="hidden dark:block" src="https://mintcdn.com/langchain-5e9cc07a-preview-update-1770920925-e15dbde/5uc5P7xRzXySGIiJ/langsmith/images/comparison-baseline-dark.png?fit=max&auto=format&n=5uc5P7xRzXySGIiJ&q=85&s=974eddbb30279f12f2f595e8b8bf99e4" alt="Configuring baseline experiment in dropdown, in dark mode." width="2556" height="1712" data-path="langsmith/images/comparison-baseline-dark.png" />
</div>

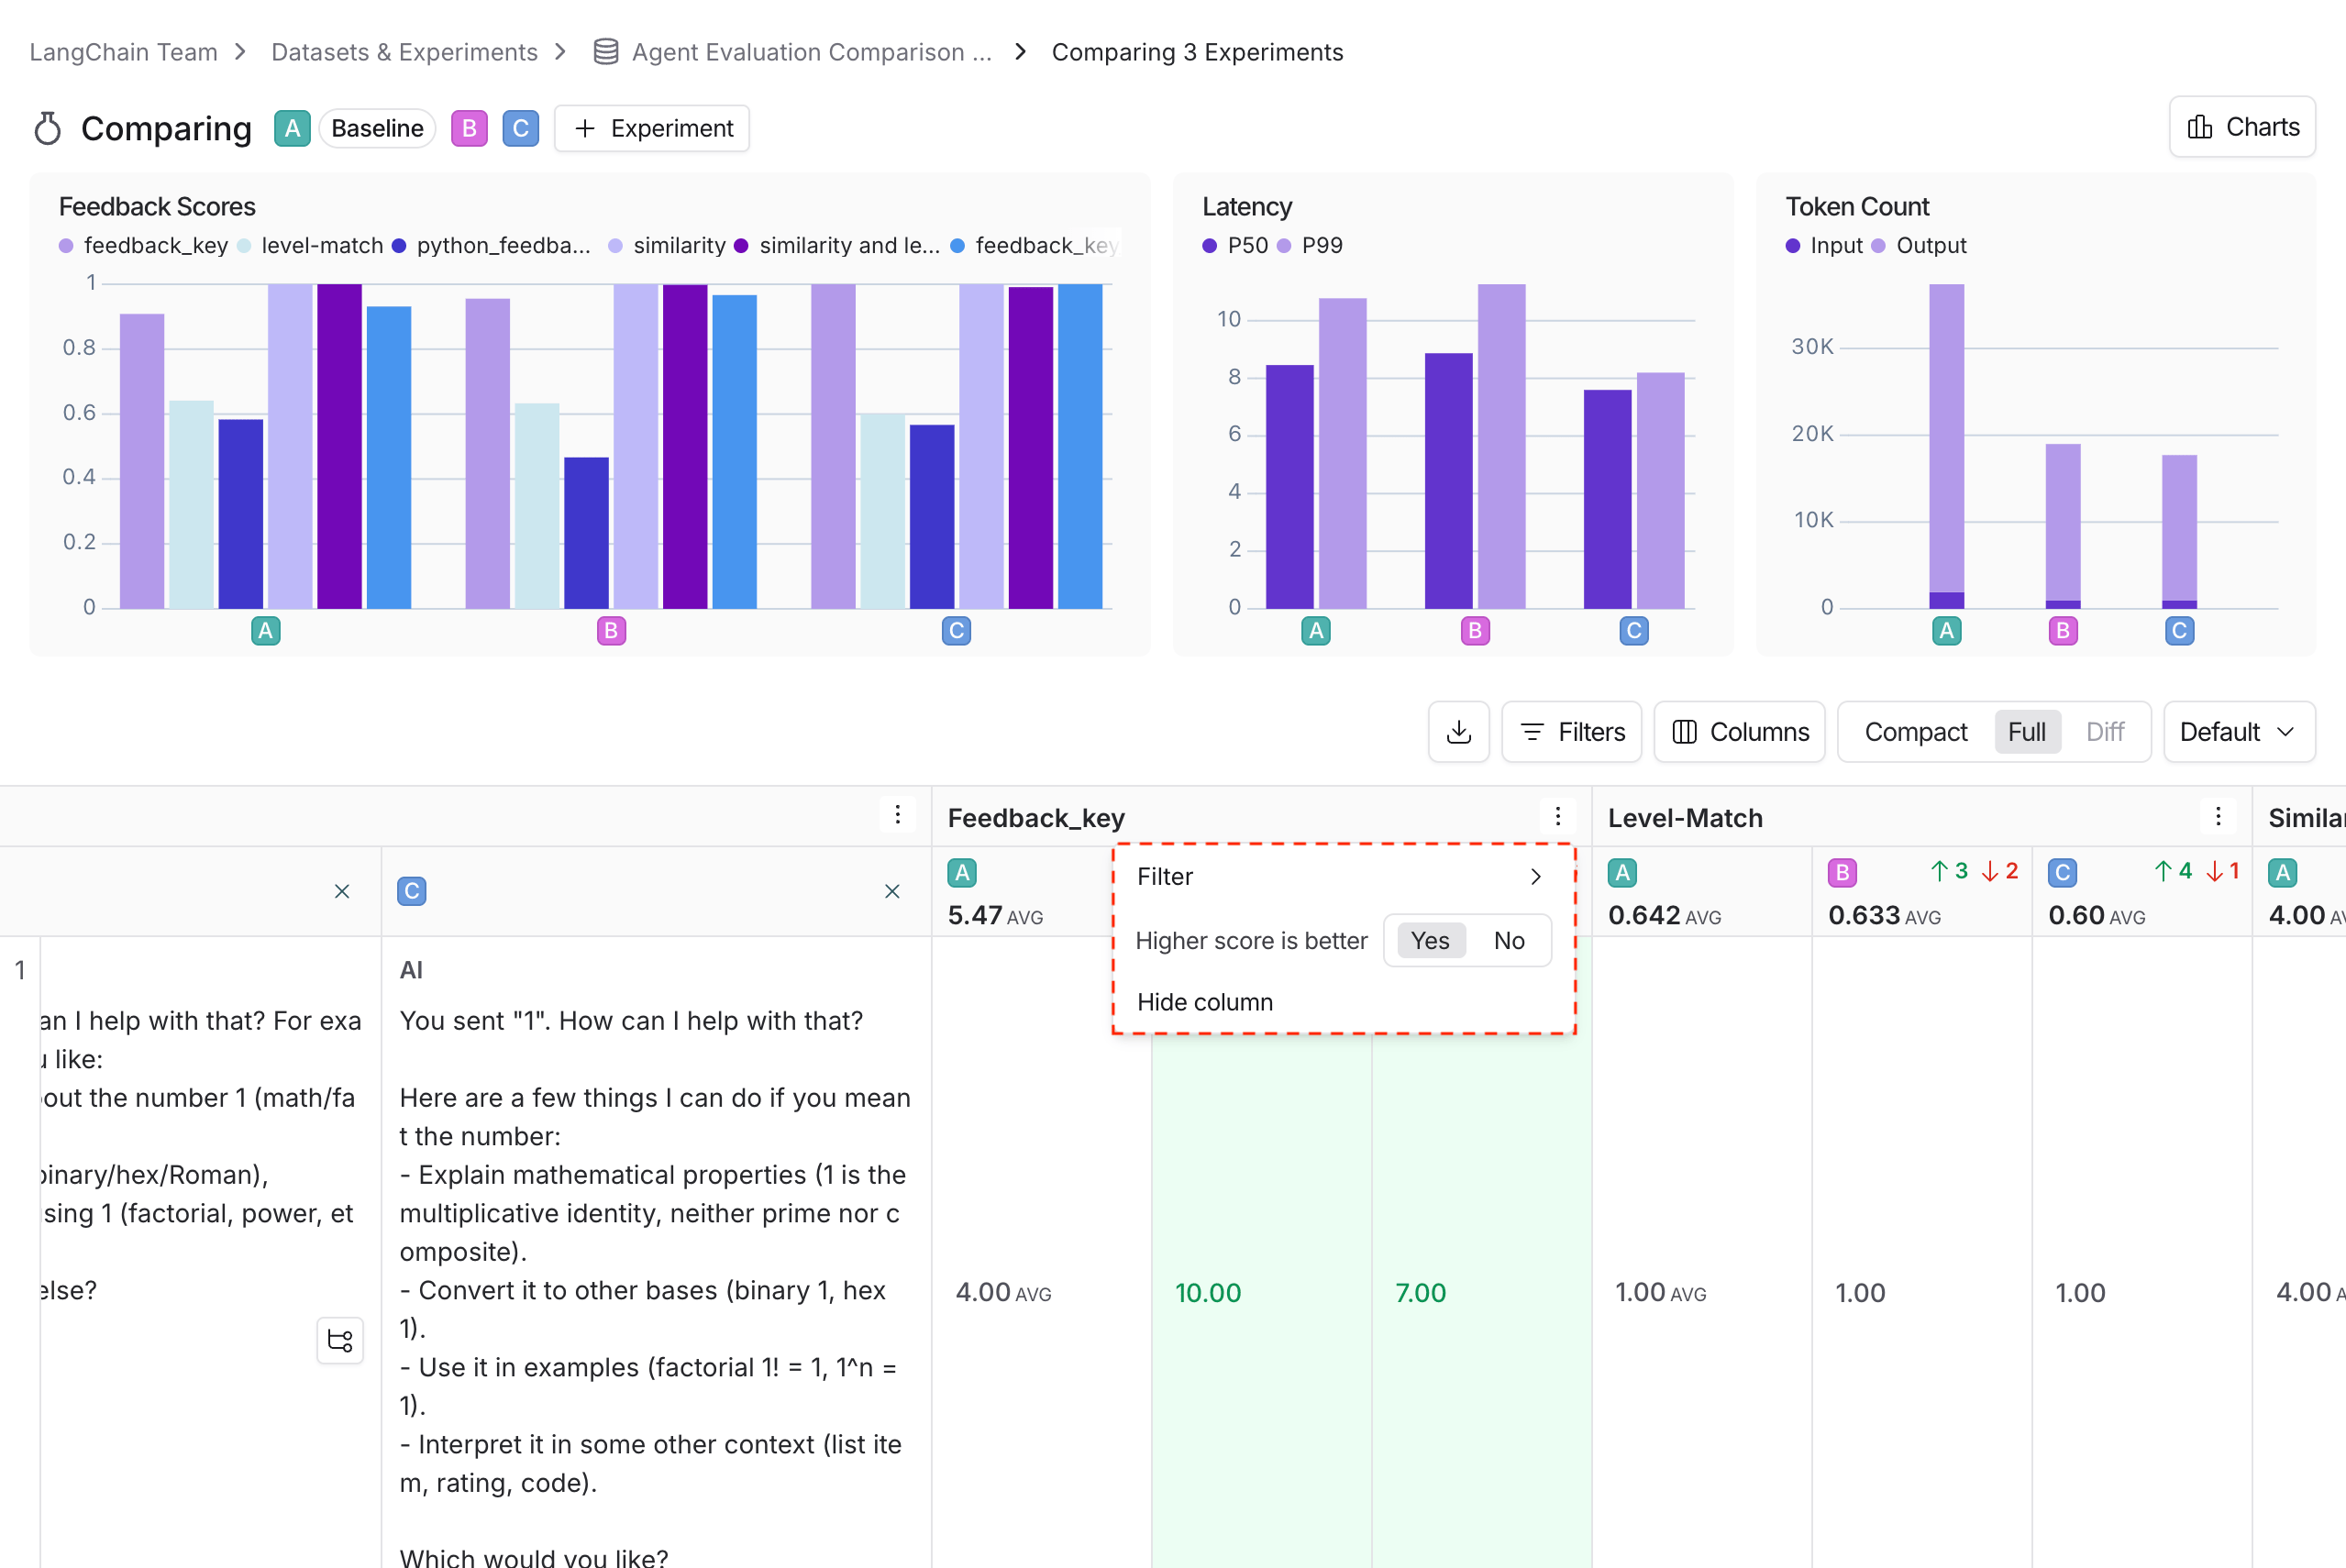
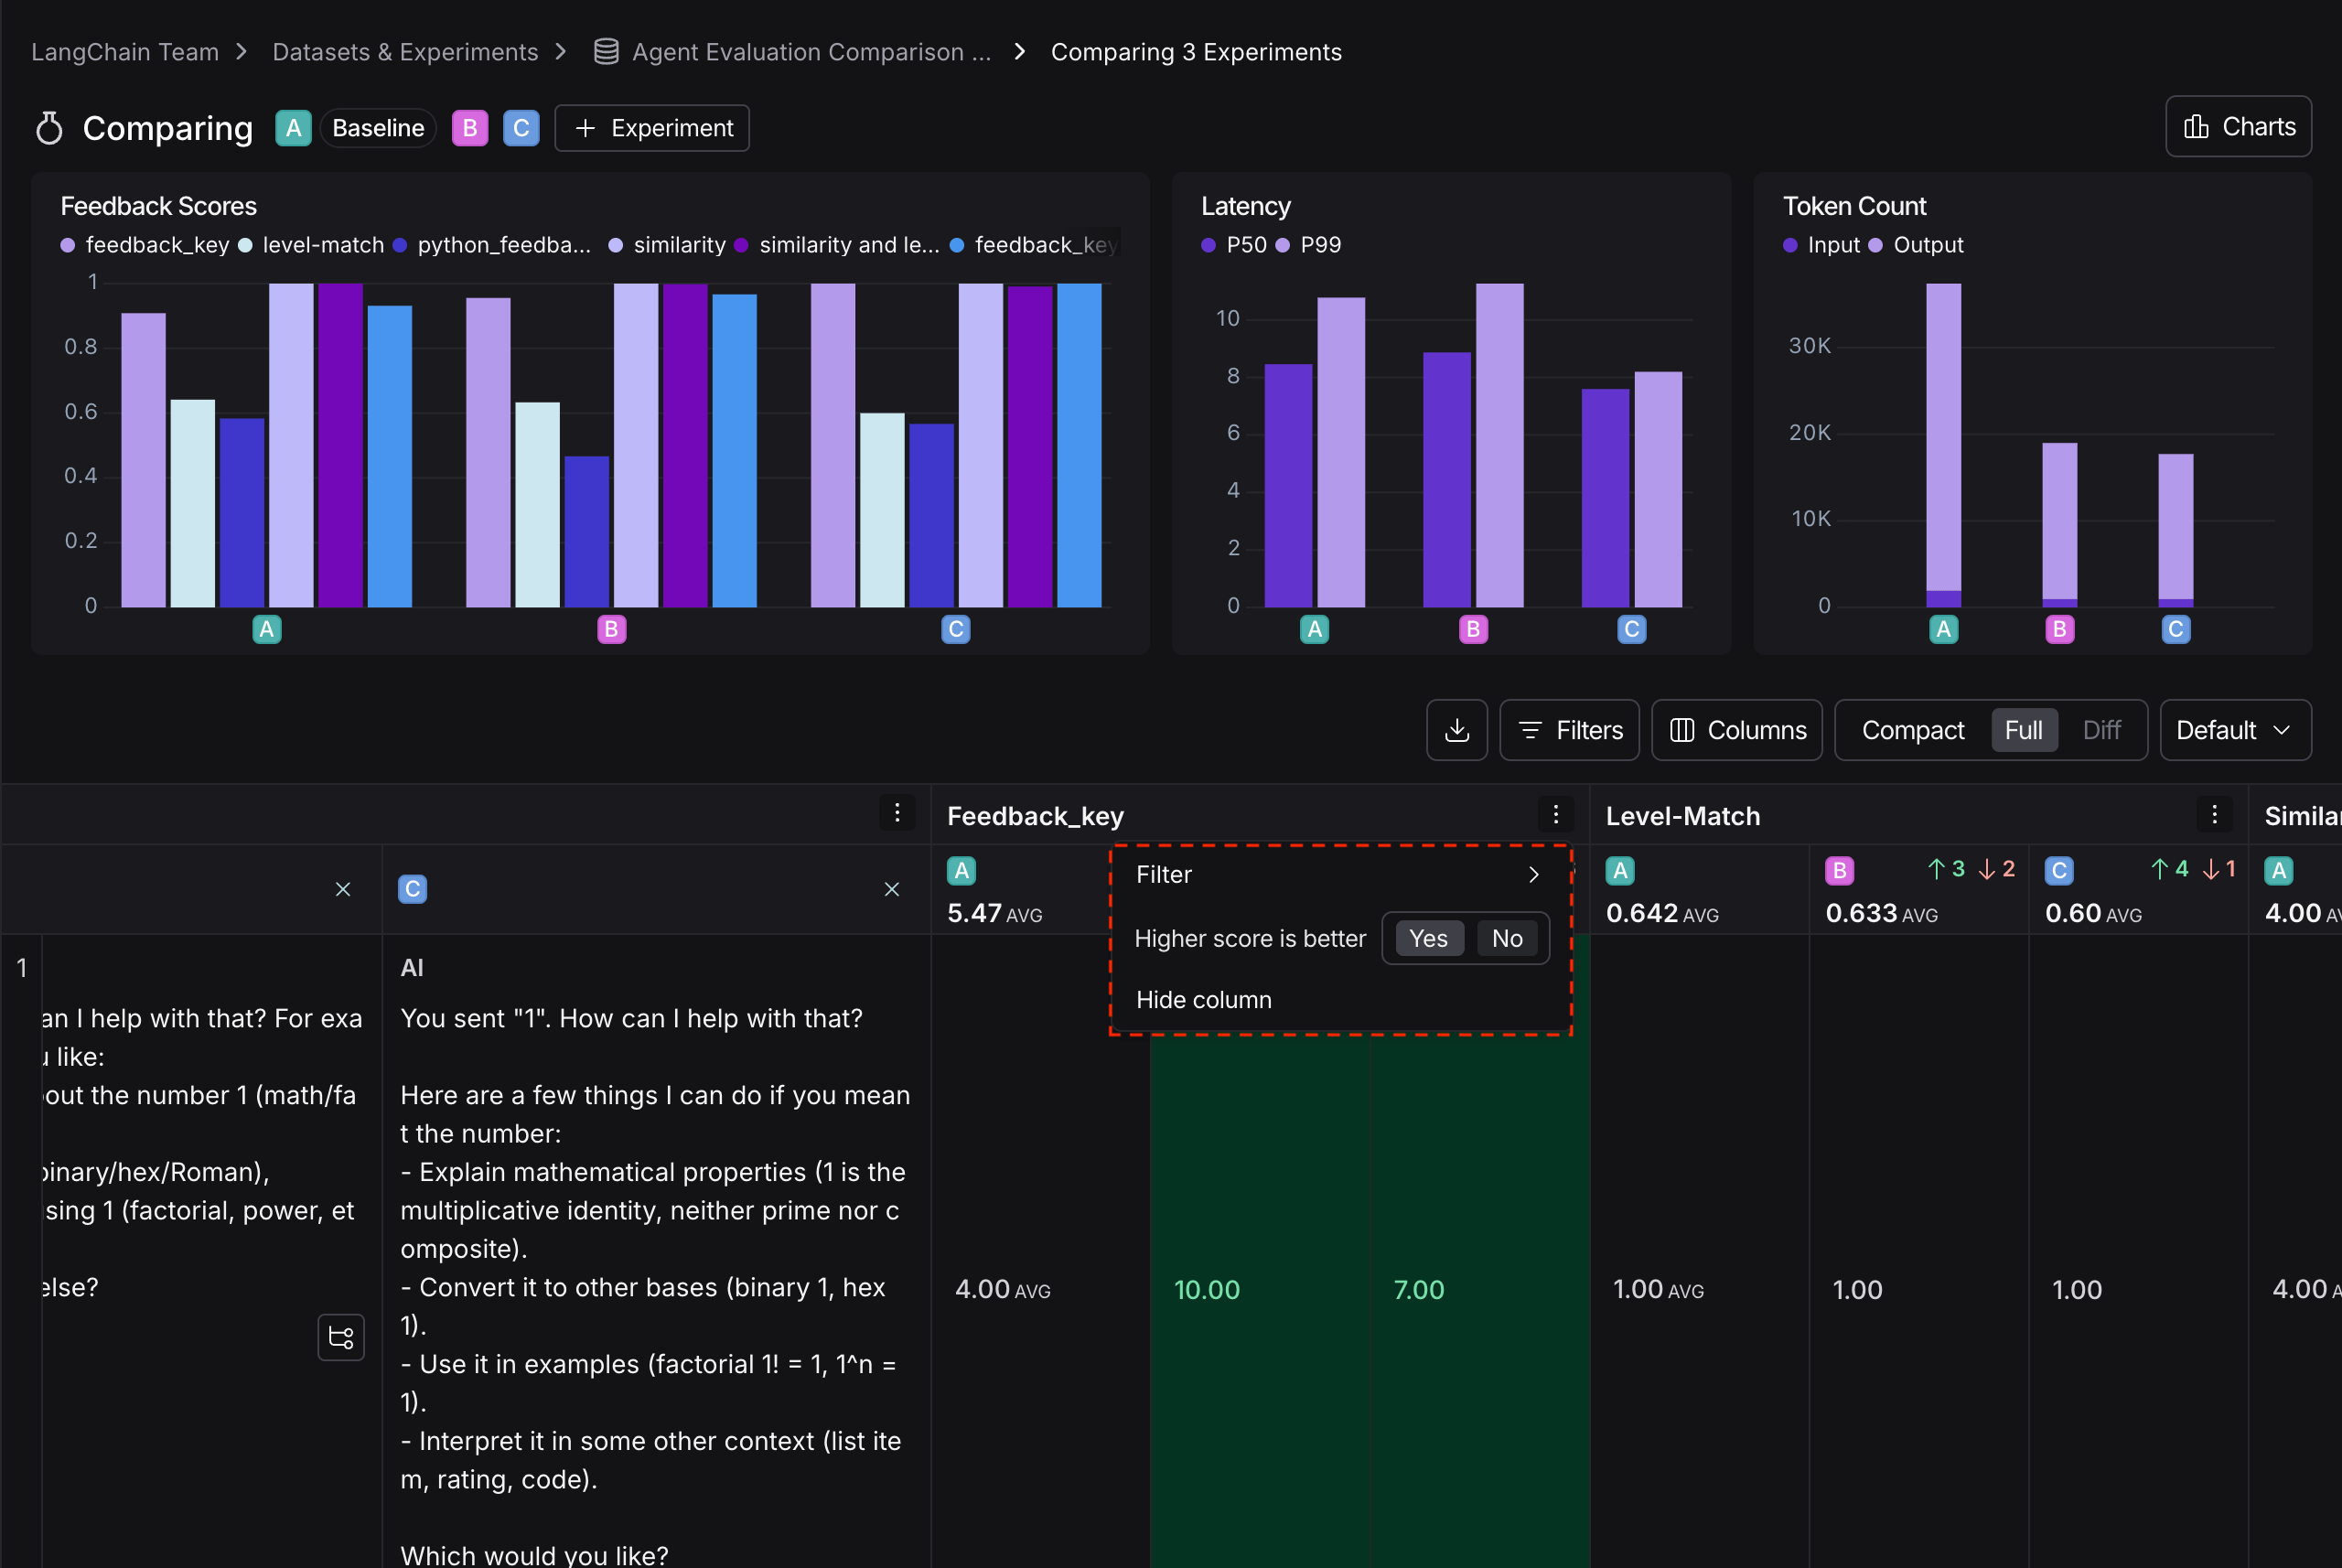
2. Within the **Feedback** columns, you can configure whether a higher score is better for each feedback key. This preference will be stored. By default, a higher score is assumed to be better.

<div style={{ textAlign: 'center' }}>
  <img className="block dark:hidden" src="https://mintcdn.com/langchain-5e9cc07a-preview-update-1770920925-e15dbde/5uc5P7xRzXySGIiJ/langsmith/images/comparison-feedback-higher-score-light.png?fit=max&auto=format&n=5uc5P7xRzXySGIiJ&q=85&s=1eae323a9e8fdec3095a8bce31c18fcb" alt="Dropdown for feedback metric column, configuring whether a higher score is better, in light mode." width="2558" height="1710" data-path="langsmith/images/comparison-feedback-higher-score-light.png" />

  <img className="hidden dark:block" src="https://mintcdn.com/langchain-5e9cc07a-preview-update-1770920925-e15dbde/5uc5P7xRzXySGIiJ/langsmith/images/comparison-feedback-higher-score-dark.png?fit=max&auto=format&n=5uc5P7xRzXySGIiJ&q=85&s=f38e6a87302d585e772be418dd8d75b4" alt="Dropdown for feedback metric column, configuring whether a higher score is better, in dark mode." width="2560" height="1714" data-path="langsmith/images/comparison-feedback-higher-score-dark.png" />
</div>

## Open a trace

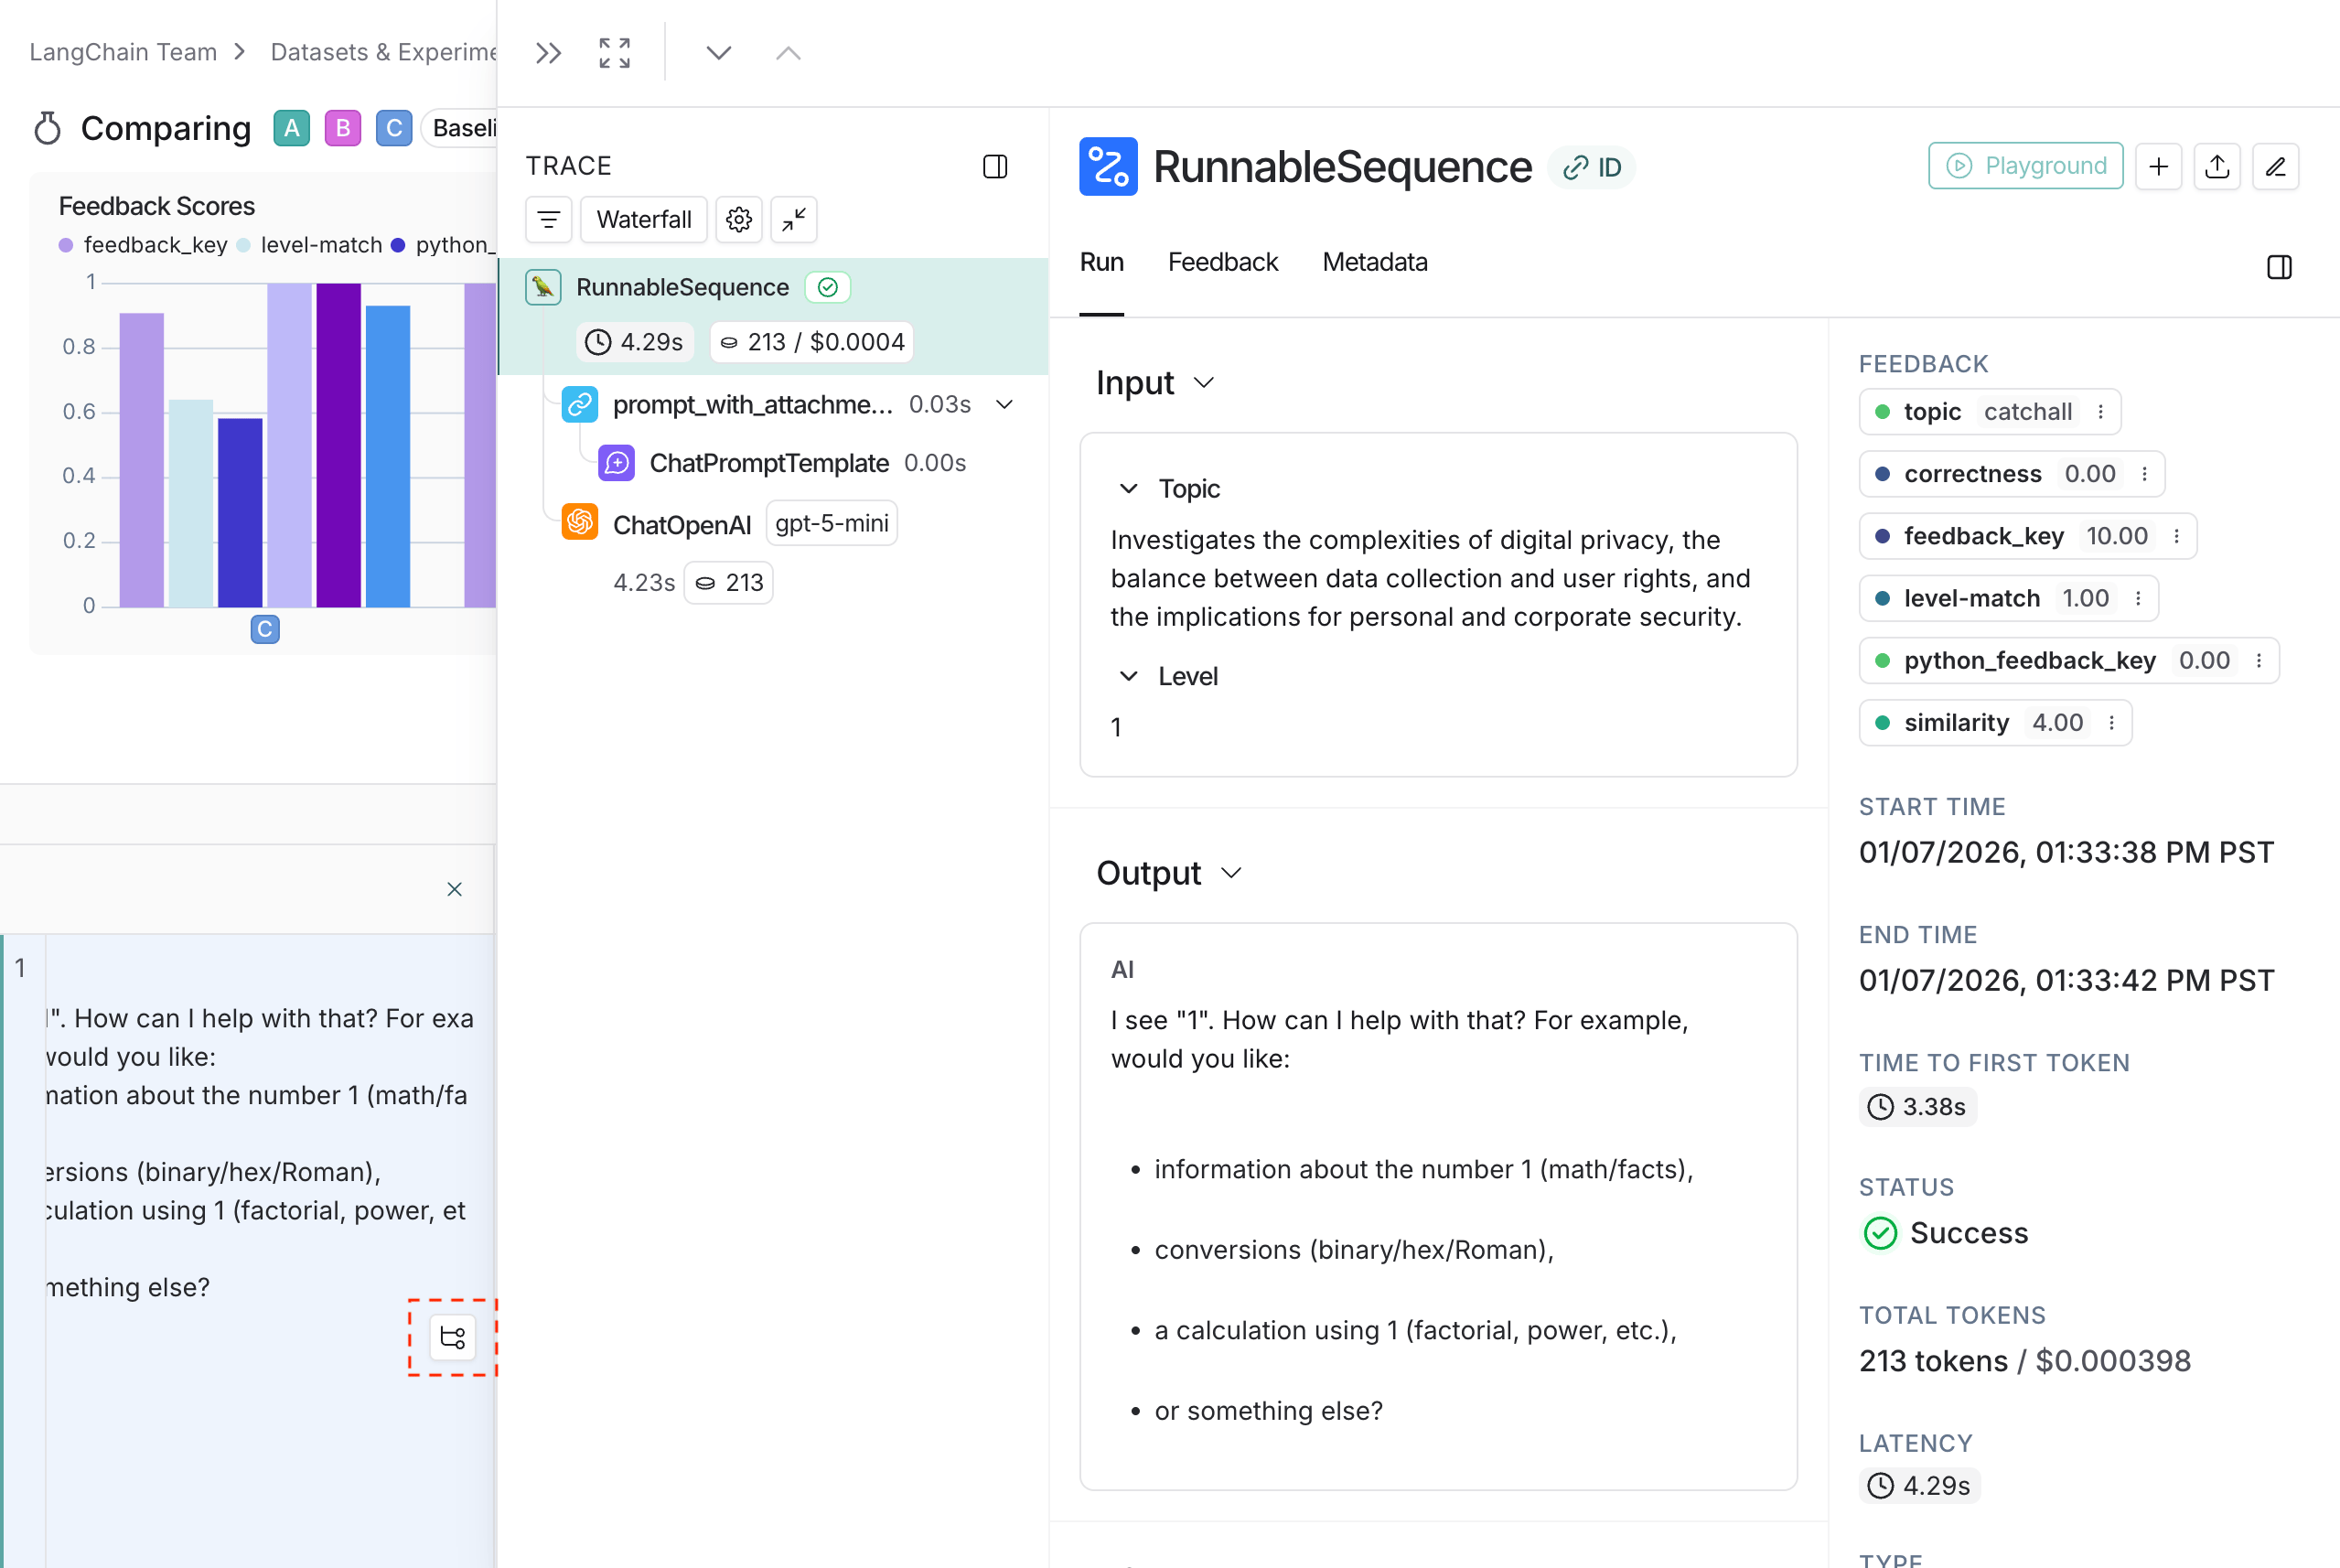
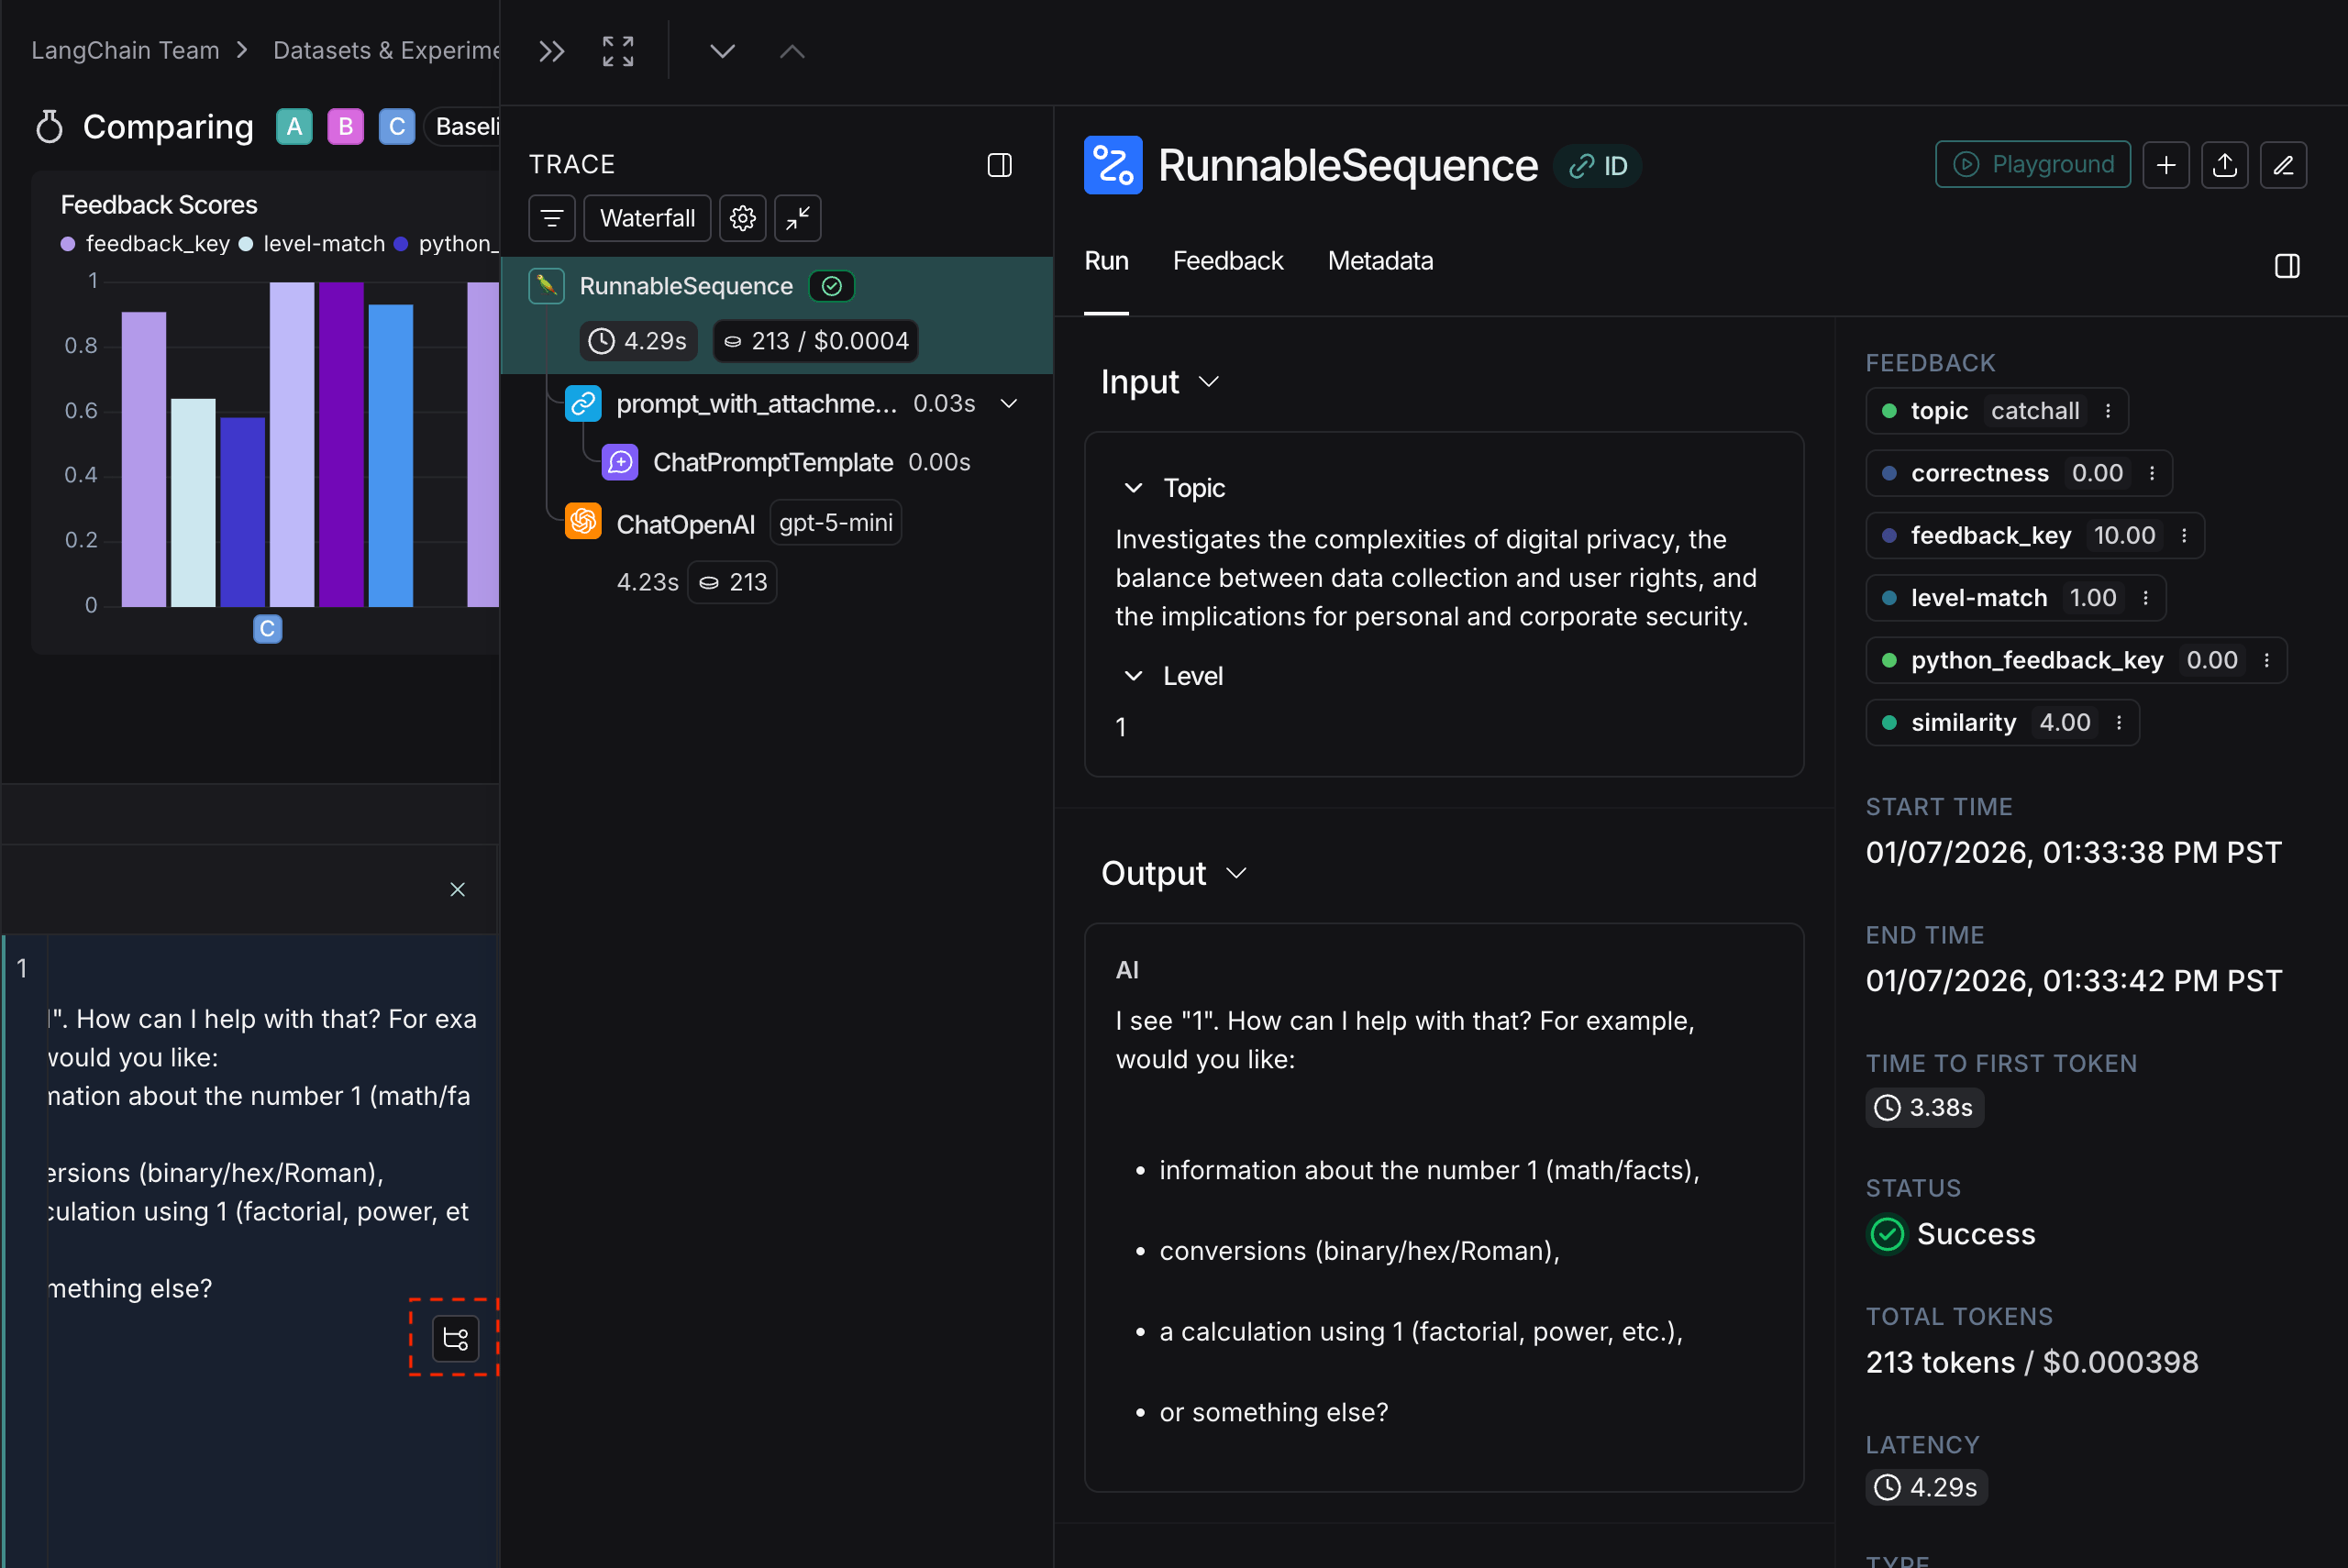
If the example you're evaluating is from an ingested [run](/langsmith/observability-concepts#runs), you can hover over the output cell and click on the trace icon to open the trace view for that run. This will open up a trace in the side panel.

<div style={{ textAlign: 'center' }}>
  <img className="block dark:hidden" src="https://mintcdn.com/langchain-5e9cc07a-preview-update-1770920925-e15dbde/fRQXipZ4YGJs6BuK/langsmith/images/open-trace-light.png?fit=max&auto=format&n=fRQXipZ4YGJs6BuK&q=85&s=4a2a2f70e729e43cba1f4a177c270c1c" alt="The View trace icon highlighted from an ingested run, light mode." width="2558" height="1714" data-path="langsmith/images/open-trace-light.png" />

  <img className="hidden dark:block" src="https://mintcdn.com/langchain-5e9cc07a-preview-update-1770920925-e15dbde/fRQXipZ4YGJs6BuK/langsmith/images/open-trace-dark.png?fit=max&auto=format&n=fRQXipZ4YGJs6BuK&q=85&s=4536d43476d0a3624f2e7890ccc2eebf" alt="The View trace icon highlighted from an ingested run, dark mode." width="2560" height="1710" data-path="langsmith/images/open-trace-dark.png" />
</div>

## Expand detailed view

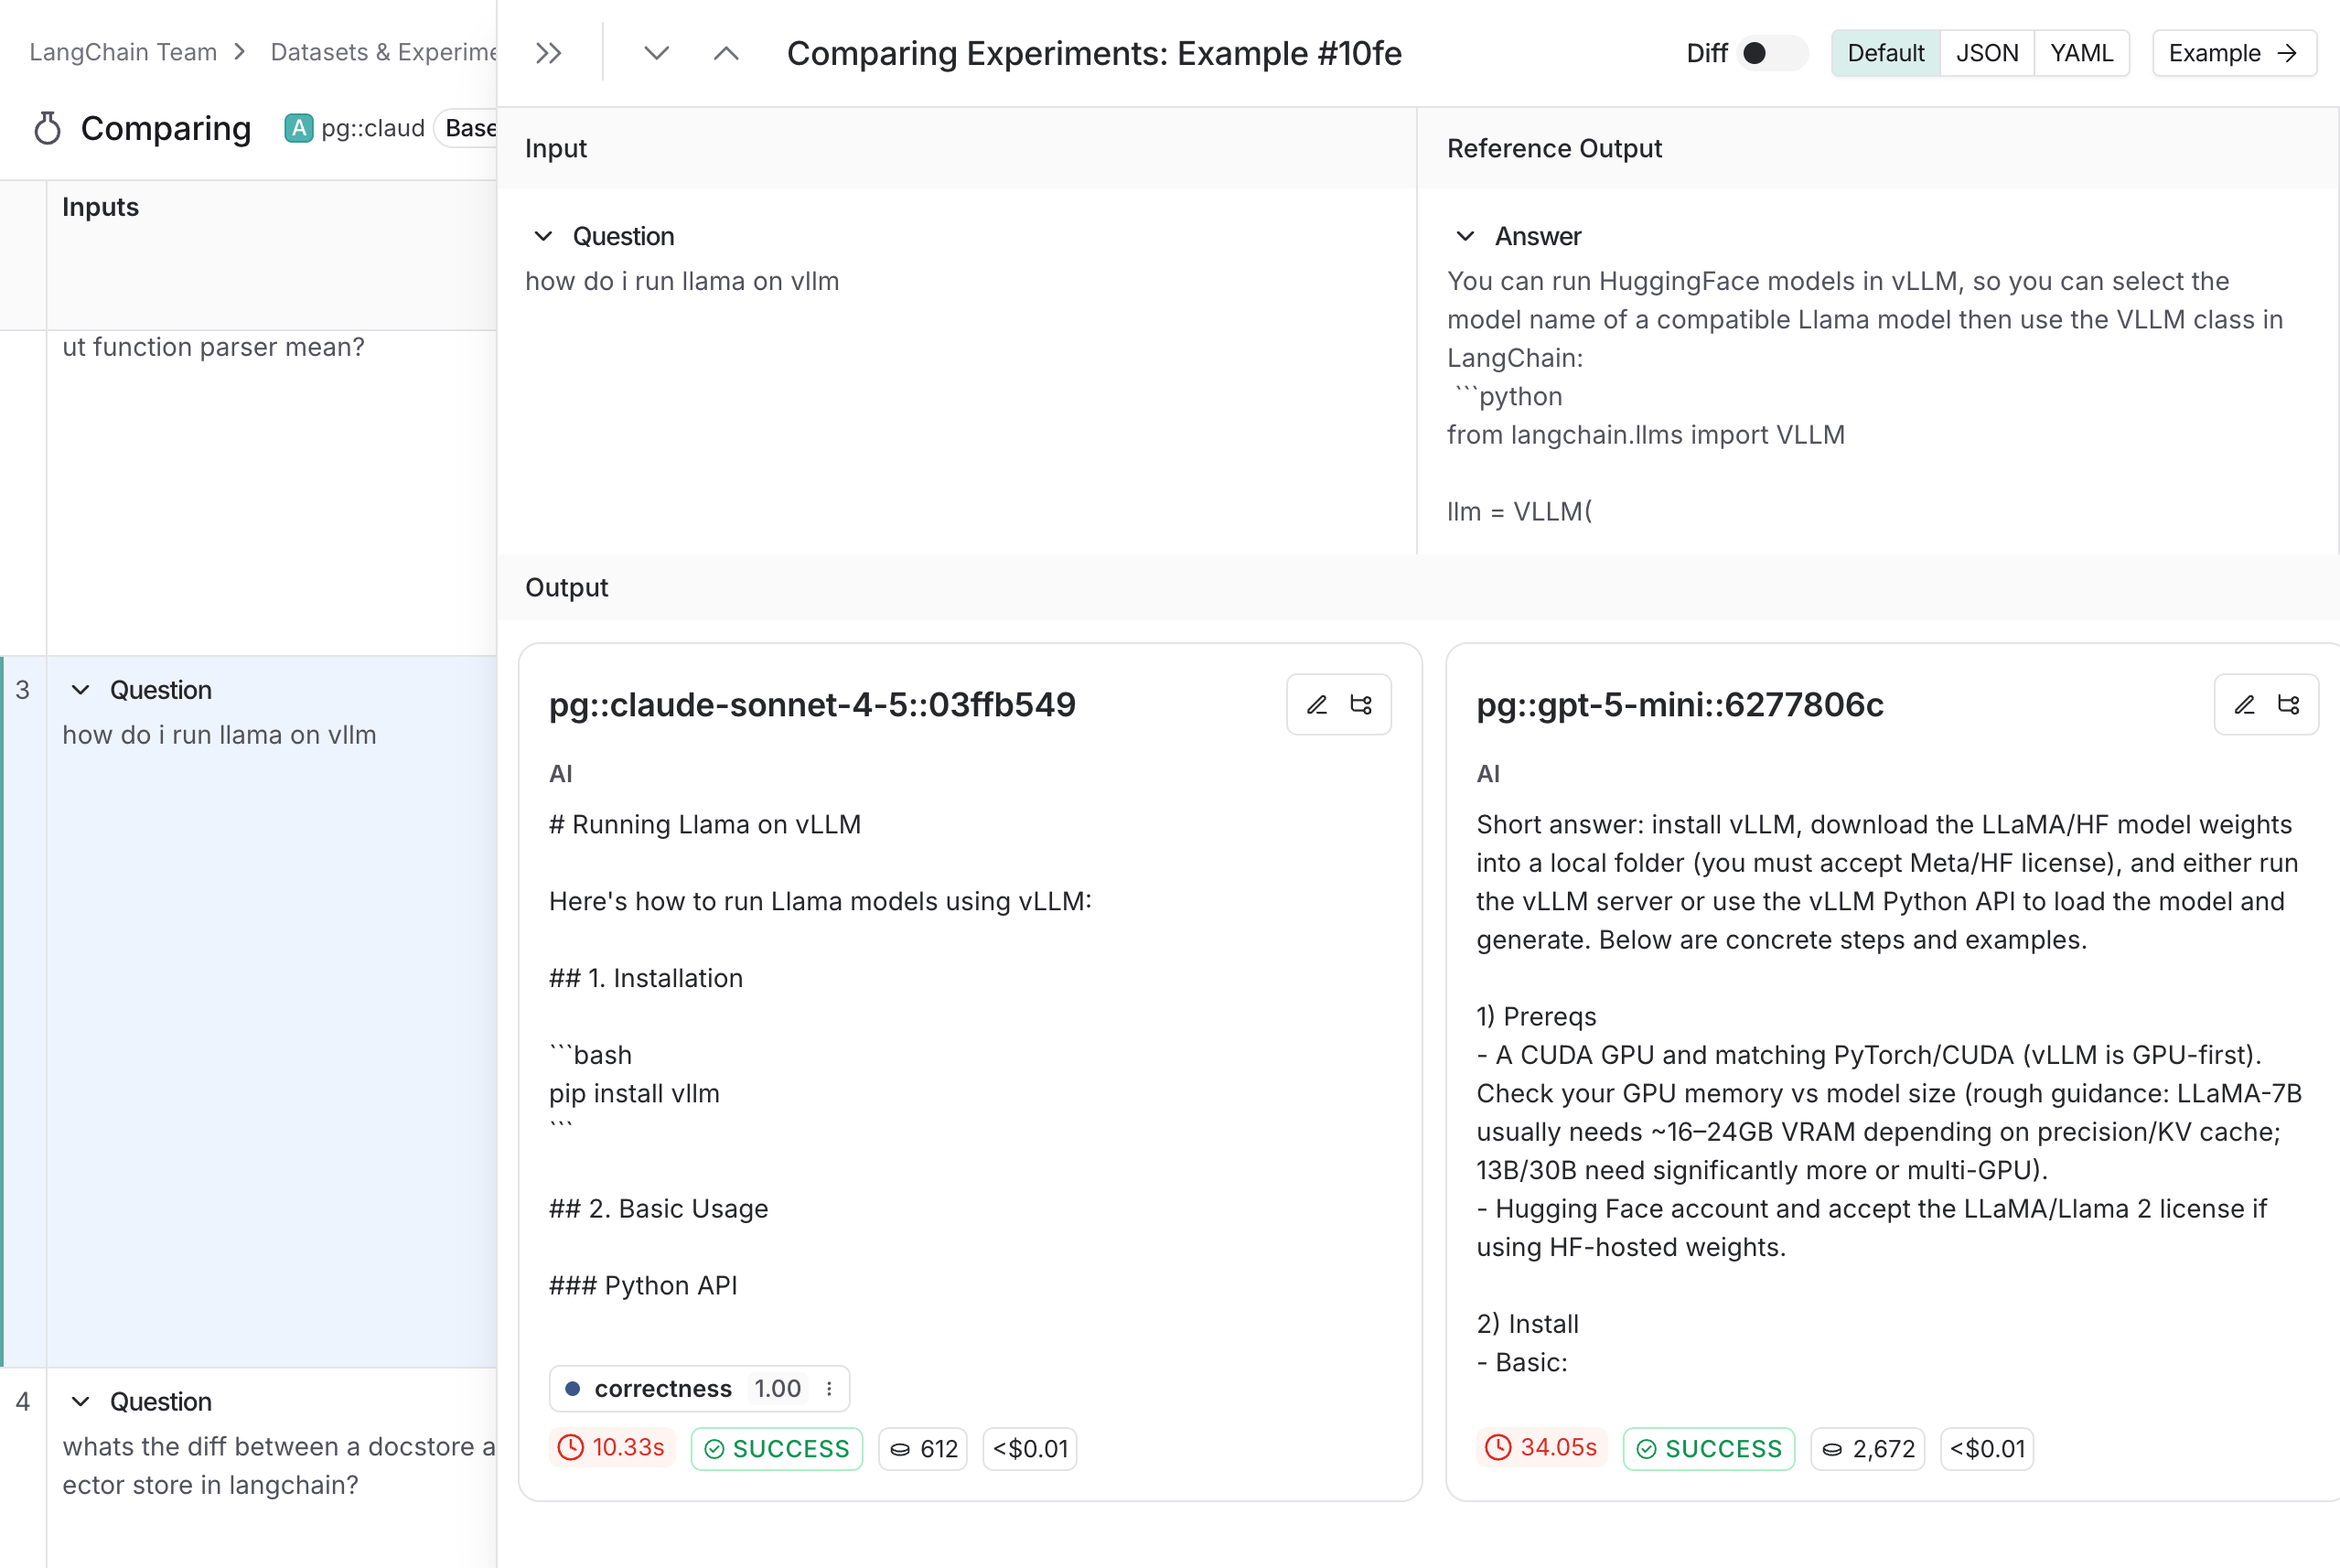
You can click on any cell to open up a detailed view of the experiment result on that particular example input, along with feedback keys and scores.

<div style={{ textAlign: 'center' }}>
  <img className="block dark:hidden" src="https://mintcdn.com/langchain-5e9cc07a-preview-update-1770920925-e15dbde/lP2Uuxqf79hMGs7b/langsmith/images/expanded-view-light.png?fit=max&auto=format&n=lP2Uuxqf79hMGs7b&q=85&s=adb62b416da34b910ca3c053dd27d909" alt="An example in the expanded Comparing Experiments view, in light mode." width="2558" height="1714" data-path="langsmith/images/expanded-view-light.png" />

  <img className="hidden dark:block" src="https://mintcdn.com/langchain-5e9cc07a-preview-update-1770920925-e15dbde/lP2Uuxqf79hMGs7b/langsmith/images/expanded-view-dark.png?fit=max&auto=format&n=lP2Uuxqf79hMGs7b&q=85&s=fef07688e26cb569b77973a1f067ad14" alt="An example in the expanded Comparing Experiments view, in dark mode." width="2556" height="1712" data-path="langsmith/images/expanded-view-dark.png" />
</div>

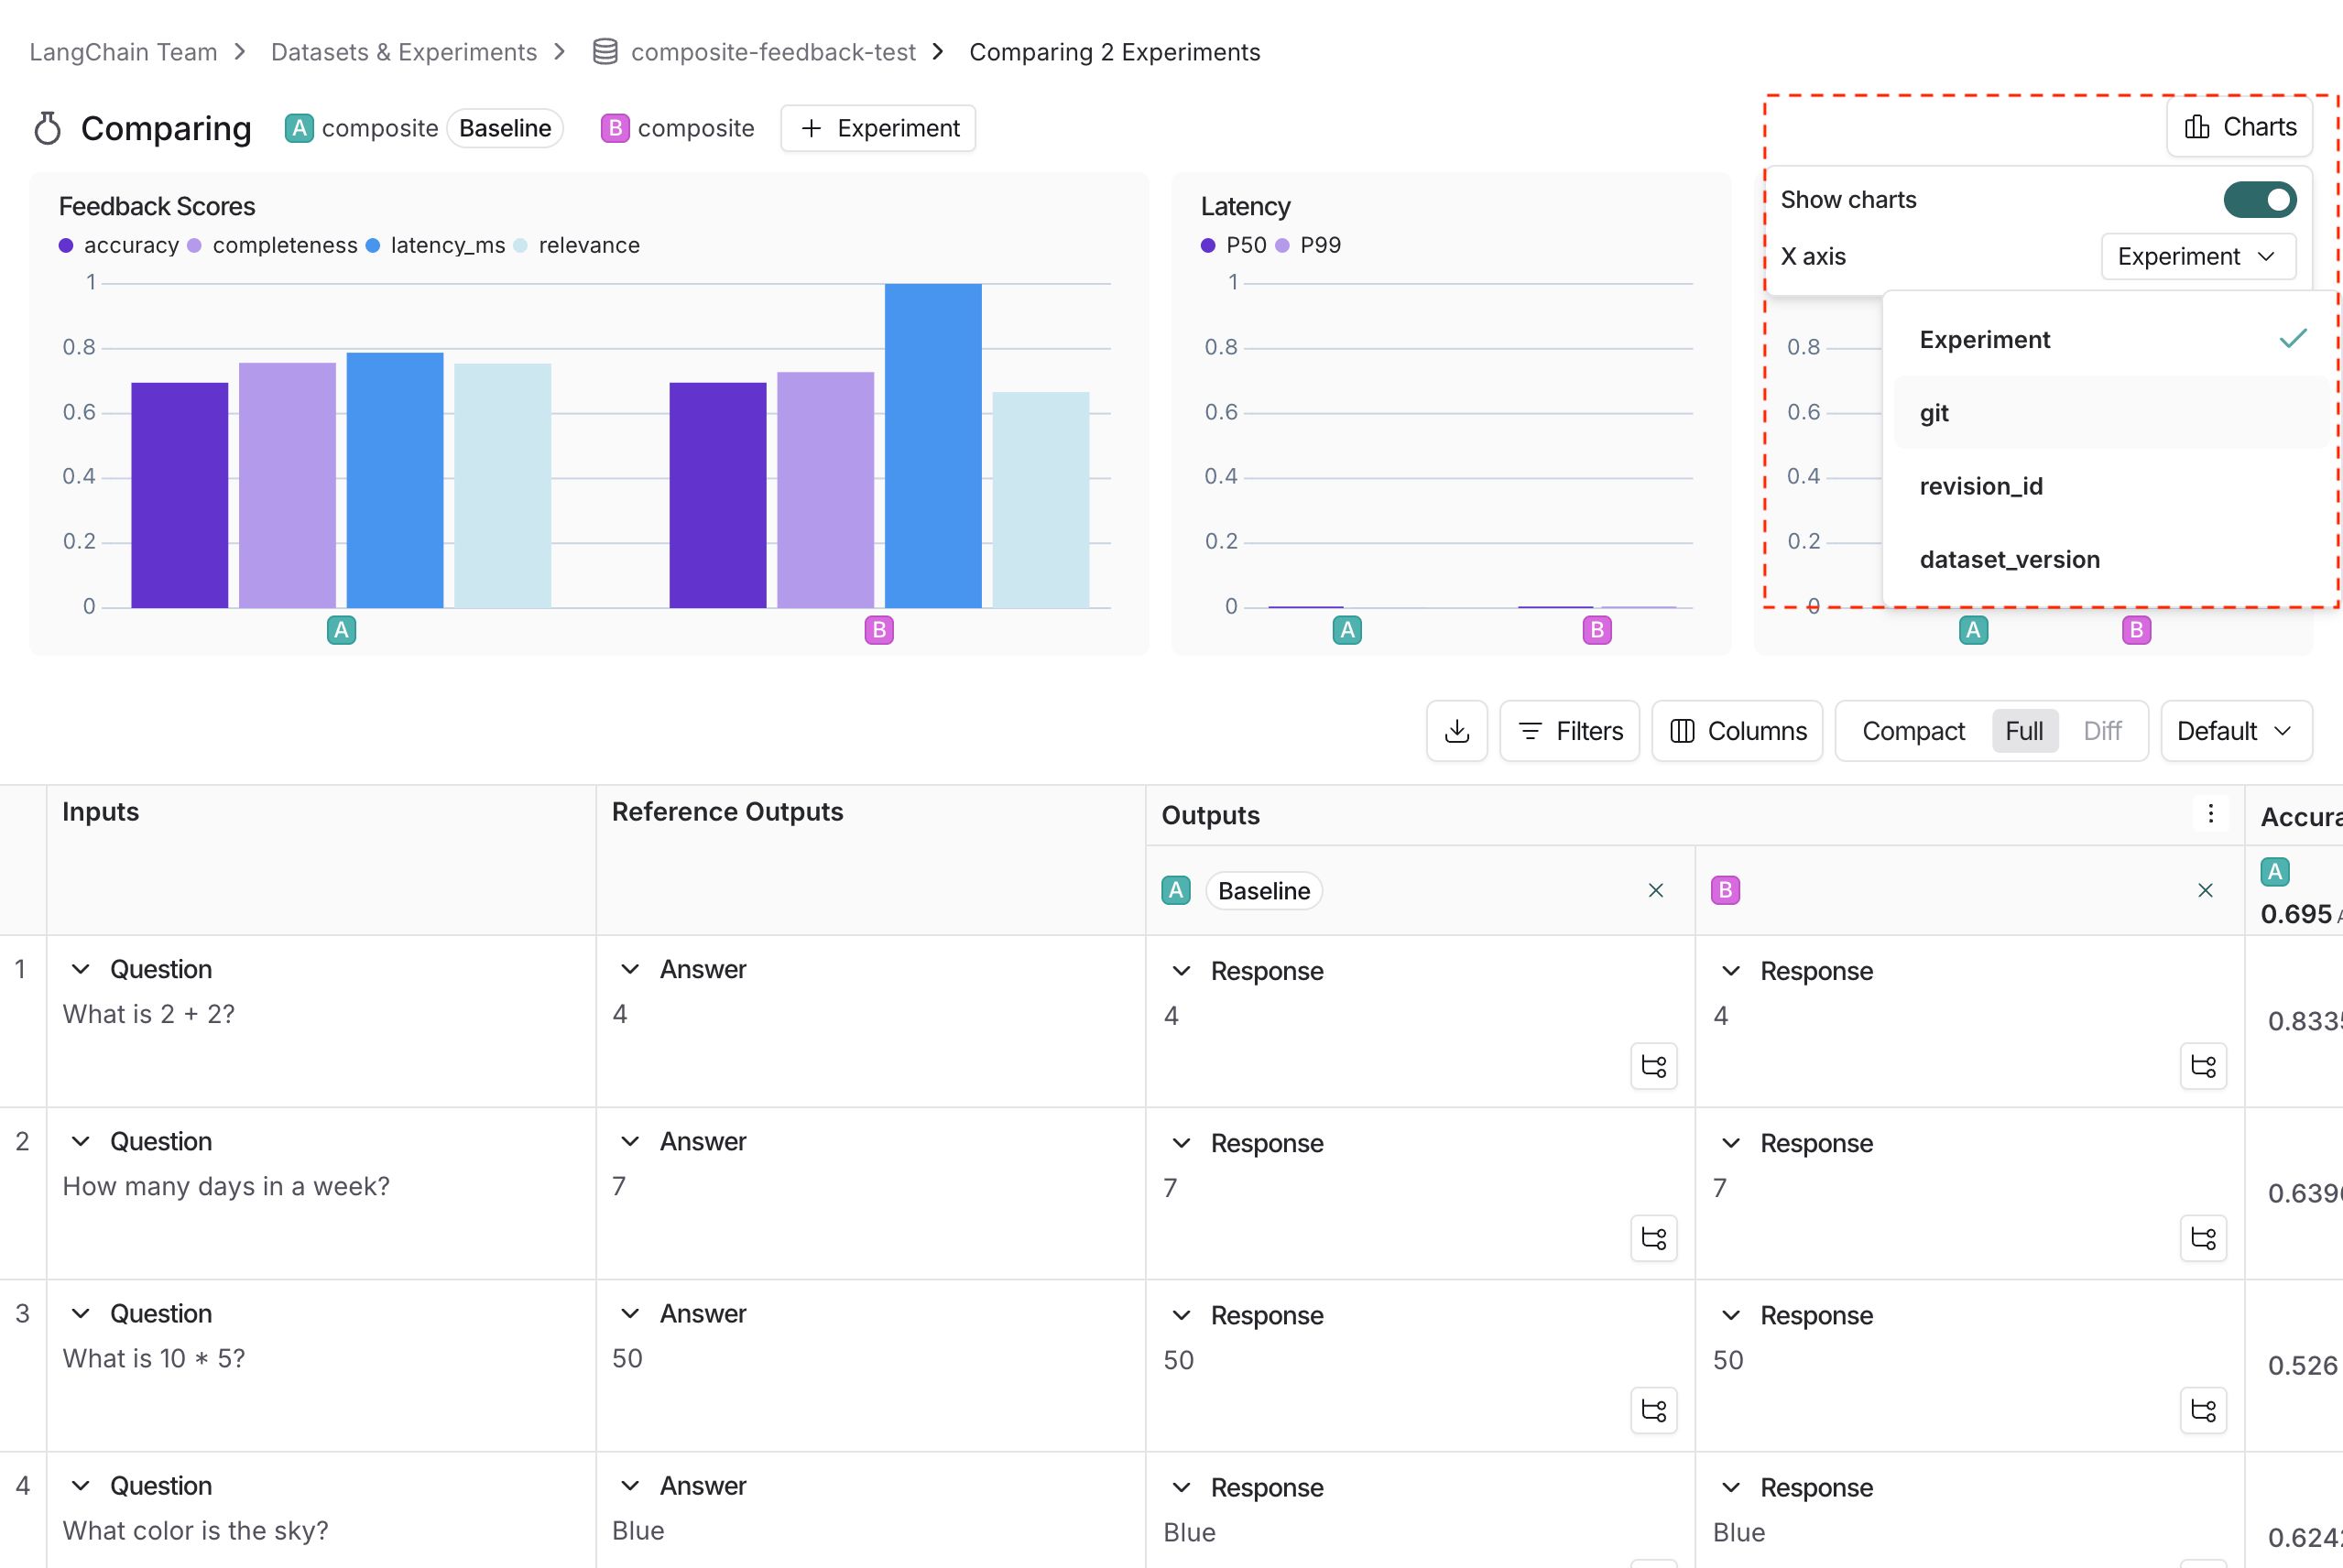
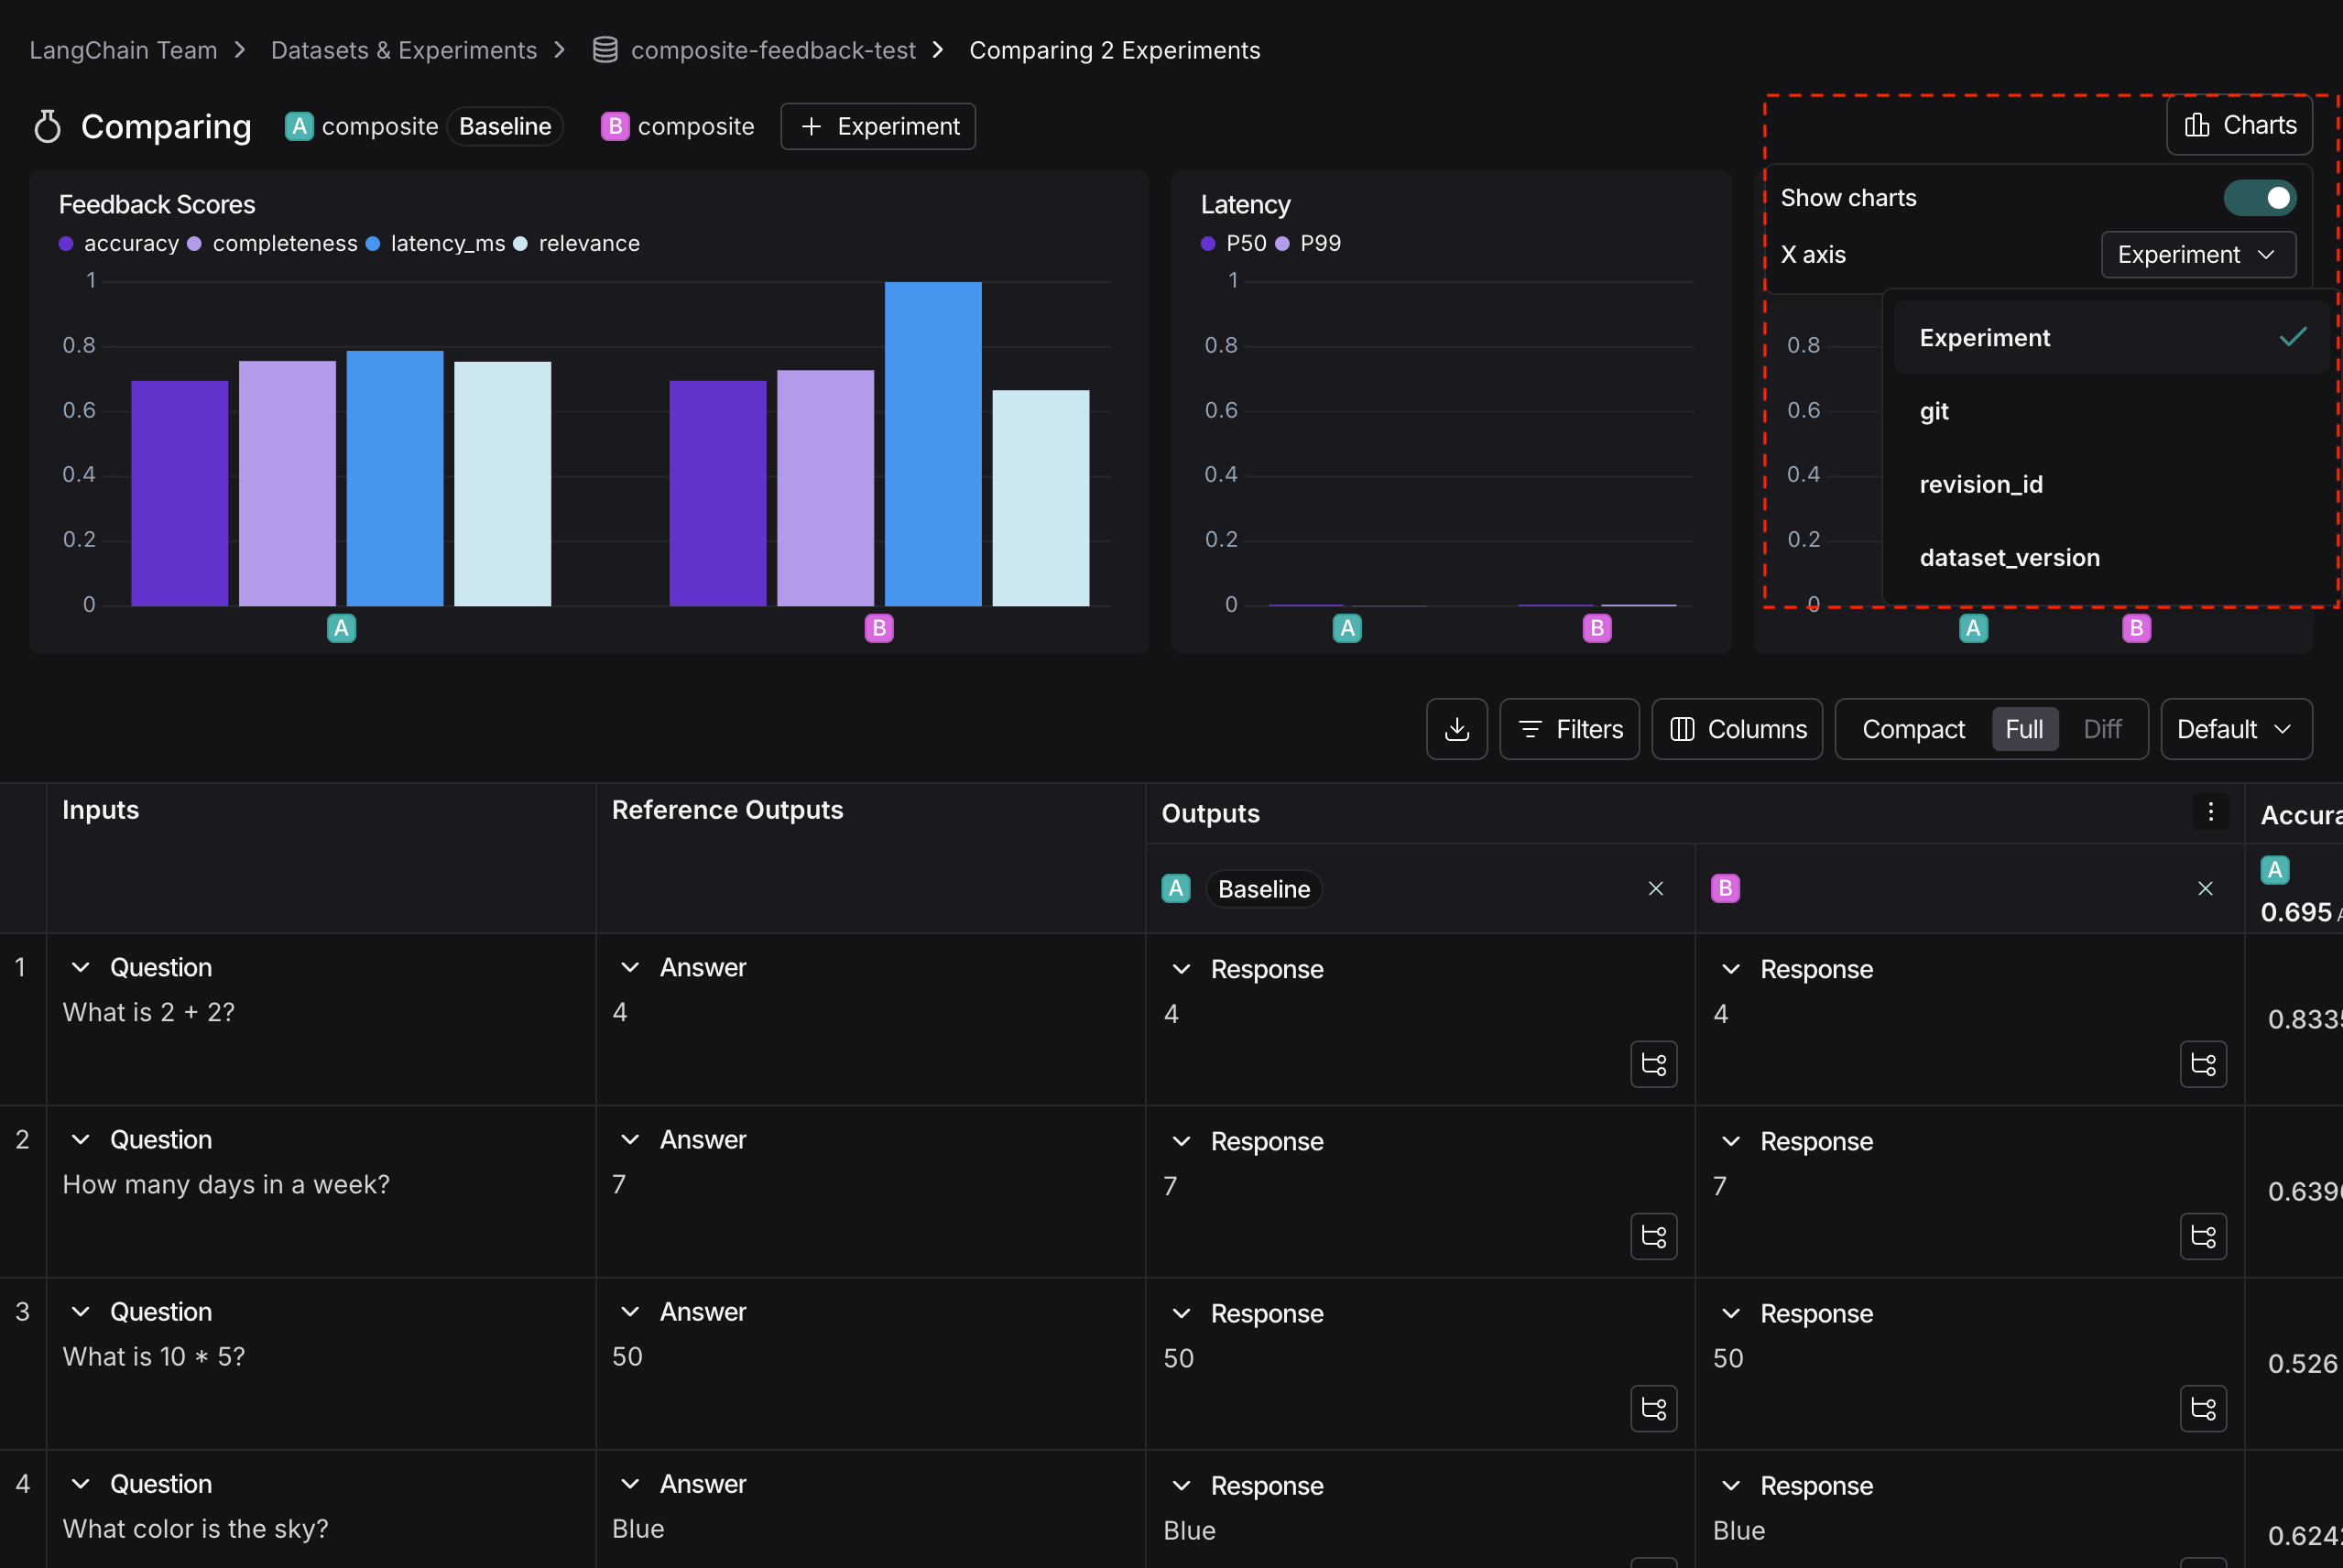
## Use experiment metadata as chart labels

You can configure the x-axis labels for the charts based on [experiment metadata](/langsmith/filter-experiments-ui#background-add-metadata-to-your-experiments).

Select a metadata key in the **charts** dropdown to change the x-axis labels.

<div style={{ textAlign: 'center' }}>
  <img className="block dark:hidden" src="https://mintcdn.com/langchain-5e9cc07a-preview-update-1770920925-e15dbde/fRQXipZ4YGJs6BuK/langsmith/images/metadata-in-charts-light.png?fit=max&auto=format&n=fRQXipZ4YGJs6BuK&q=85&s=c5a1a091cc9790c0d8c4baede03348ae" alt="x-axis dropdown highlighted with a list of the metadata attached to the experiment, in light mode." width="2558" height="1712" data-path="langsmith/images/metadata-in-charts-light.png" />

  <img className="hidden dark:block" src="https://mintcdn.com/langchain-5e9cc07a-preview-update-1770920925-e15dbde/fRQXipZ4YGJs6BuK/langsmith/images/metadata-in-charts-dark.png?fit=max&auto=format&n=fRQXipZ4YGJs6BuK&q=85&s=7268414928ba471d2ec7edfe0aa42da6" alt="x-axis dropdown highlighted with a list of the metadata attached to the experiment, in dark mode." width="2558" height="1712" data-path="langsmith/images/metadata-in-charts-dark.png" />
</div>

***

<Callout icon="pen-to-square" iconType="regular">
  [Edit this page on GitHub](https://github.com/langchain-ai/docs/edit/main/src/langsmith/compare-experiment-results.mdx) or [file an issue](https://github.com/langchain-ai/docs/issues/new/choose).
</Callout>

<Tip icon="terminal" iconType="regular">
  [Connect these docs](/use-these-docs) to Claude, VSCode, and more via MCP for real-time answers.
</Tip>